Why diagnostic agents fail on raw logs: effective context cliffs and the log Pareto frontier
- Published
- Data
- 907,166-line (94.16 MB) 6-node distributed incident corpus + 1.21 GB (8,542,166-line) 12-system Zenodo public suite + 32,000-line Loghub-16 benchmark
- Figures
- 3
The claim
Why do autonomous diagnostic agents fail when given direct access to production server logs? Across 335 enterprise failures and 68 GB of telemetry, a frontier model solved only 11.34% of cases from raw logs (Xu et al., 2025).
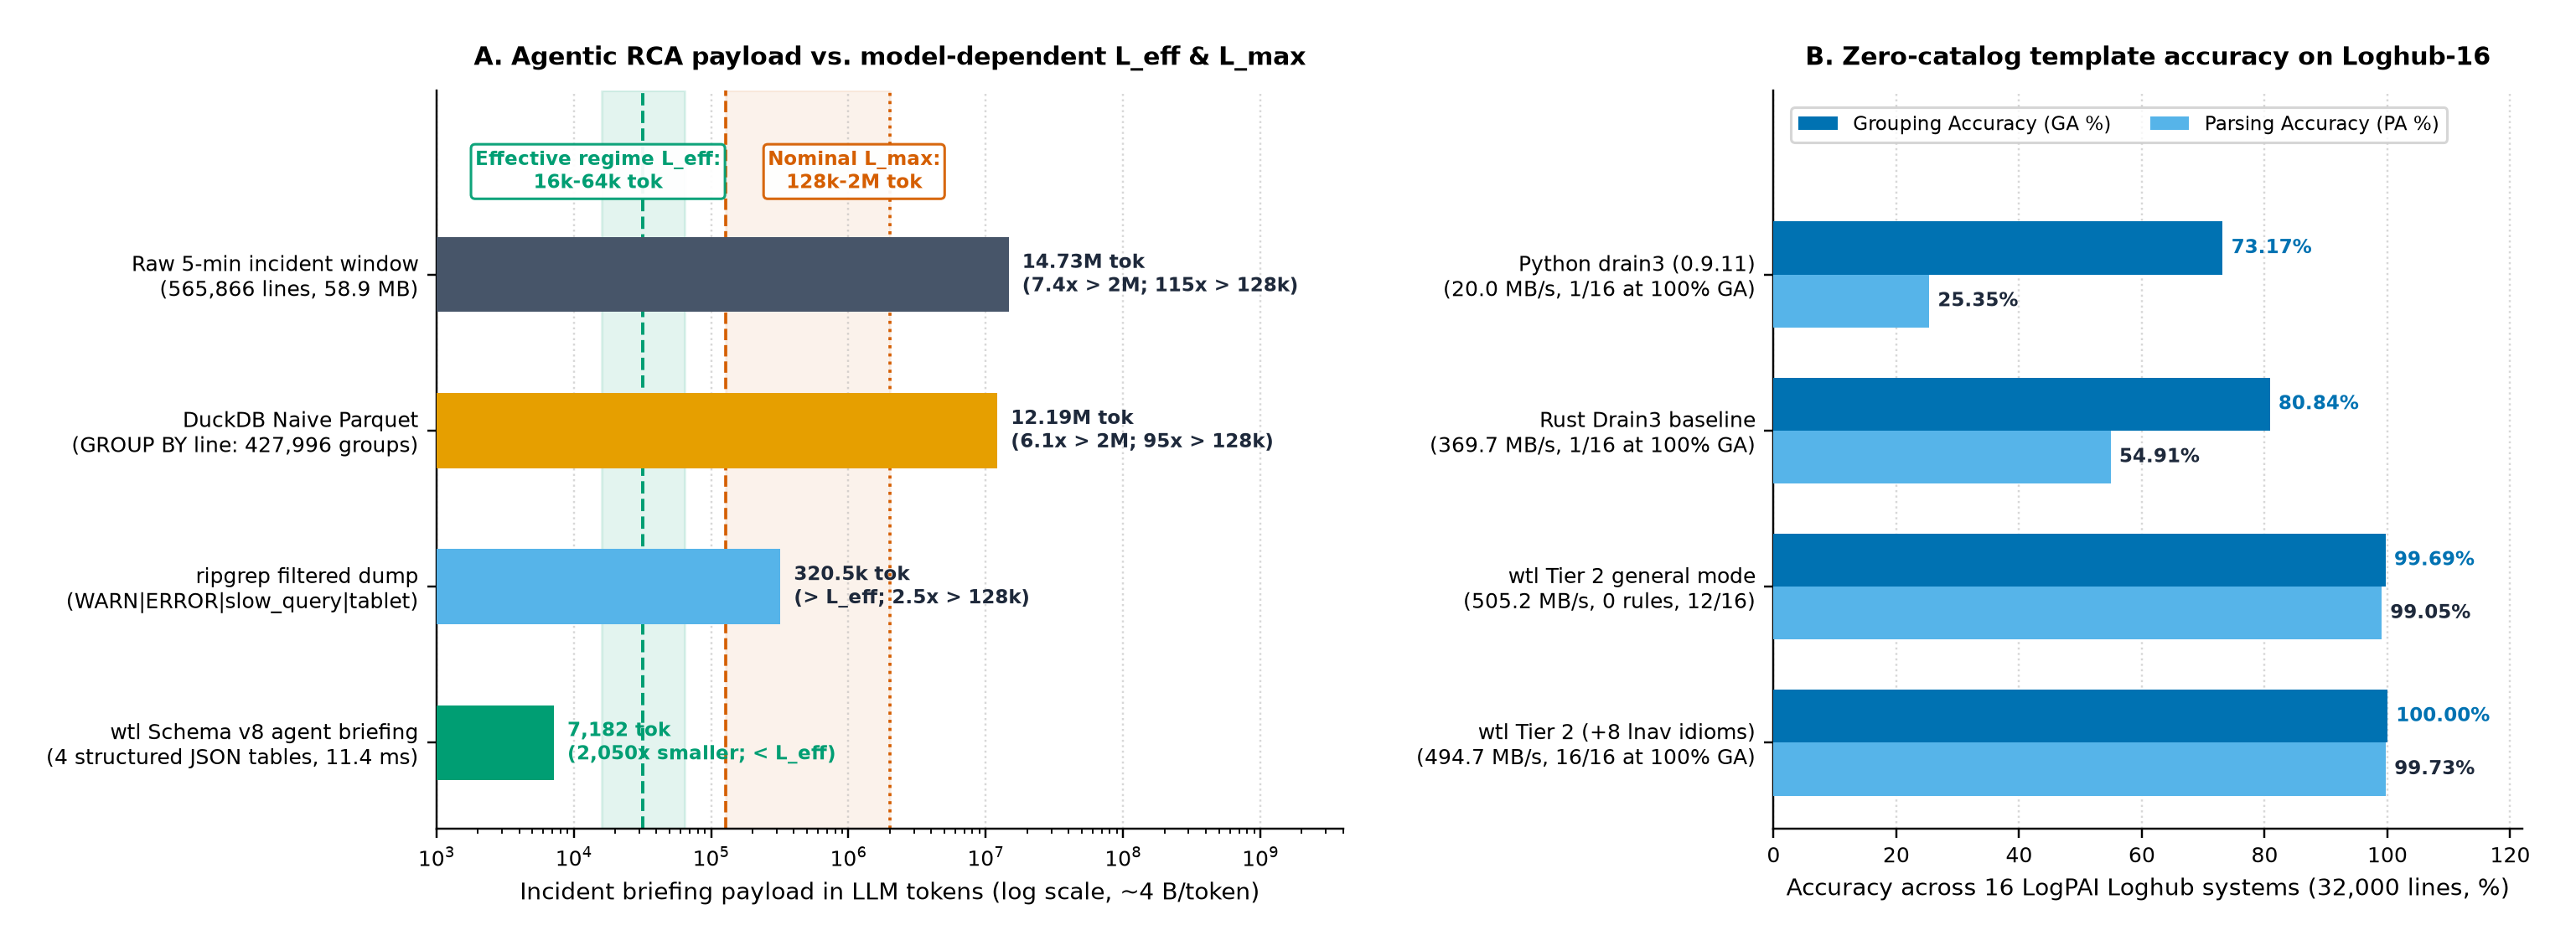
For an autonomous diagnostic agent, two model-dependent boundaries govern root-cause accuracy. The outer boundary is the nominal context limit (L_max), spanning 128,000 (128k) tokens locally to 1M or 2M tokens on cloud APIs. The inner boundary is the effective high-attention regime (L_eff), typically 16k to 64k tokens on tracing and aggregation (with 32k as midpoint). Below L_eff, models avoid U-shaped "Lost in the Middle" recall collapse (Liu et al., 2024; Hsieh et al., 2024). They also avoid input-length reasoning decay (Levy et al., 2024).
During a 5-minute distributed database incident across 6 nodes, raw logs reach 565,866 lines (58.9 MB). That volume equals 14,725,987 (14.73M) tokens. It exceeds even a 2M-token frontier context window by 7.4x (14.7x over 1M; 115x over 128k). A filtered ripgrep dump of warnings, errors, slow queries, and tablet lines emits 320,489 (320.5k) tokens (1.28 MB). Even when a 1M or 2M model accepts 320.5k tokens, that payload sits 5x to 20x past L_eff (16k to 64k). It also inflates prefill latency and KV-cache cost on every turn.
Conventional log benchmarks compare tools as byte archivers (gzip, zstd, CLP) or single-keyword text scanners (ripgrep). That framing misses the purpose of a diagnostic log engine in distributed systems (Xu et al., 2009; Zhao et al., 2014).
We built our Rust log-to-Parquet engine (what_the_log, wtl) to bridge raw logs and structured reasoning (report 06, report 08, report 15). It uses 51,954 canonical source-mined templates and run-length encoding to cut production prompt tokens by 74.2x to 88.4x (report 06). We are preparing the engine for open-source release under the Apache 2.0 license in the coming weeks. It converts multi-node logs into an entity-indexed, quantitatively summarized Apache Parquet lakehouse (Schema v8, 34 columns, 11 Split-Block Bloom Filters). We benchmarked it against ripgrep, lnav, zstd, gzip, Drain3, and DuckDB over raw CSV and naive 1:1 Parquet.
- Distributed systems diagnosis and agentic root-cause analysis (D1 to D5, 907,166 lines, 94.16 MB across 6 nodes + 16 Loghub-16 systems). Our engine compresses 94.16 MB into 1.93 MB of Schema v8 Parquet (48.77x compression, 2.58x smaller than 4.99 MB naive Parquet, 36.8x fewer rows). It executes all 4 core distributed diagnostic queries (D1 to D4) in 16.06 ms total. That is 49.6x faster than 796.38 ms naive Parquet and 975.5x faster than 15,666.62 ms
ripgrep+awk/sed. Including 0.74 s ingest, it breaks even on the first diagnostic session (k* = 1: 0.76 s vs 0.88 s naive Parquet and 1.14 s CSV). For an AI agent (D5), it builds a complete 4-table incident briefing in 11.38 ms using 7,182 tokens (28.7 KB). That briefing is 2,050x smaller than raw logs and 44.6x smaller thanripgrep. At 7,182 tokens, it stays belowL_effacross both local (16k to 32k) and frontier (64k+) models. - Full-scale 1.21 GB (1,213.33 MB, 8,542,166-line) public Zenodo LogPAI suite (12 production systems, 991
.logfiles). Before open-sourcing, we benchmarked against unedited public logs from Zenodo Record 8196385 (Zhu et al., 2023). Our 32 validatedlnavformats achieve 100.0% logical record coverage (8,314,141 of 8,314,141 records). The resulting 62.39 MB Schema v8 Parquet (19.45x compression; 40.46x on 743.19 MB BGL) is 1.69x smaller thanzstd -3(105.14 MB). It is also 1.73x smaller than naiveDuckDBParquet (108.00 MB). It speeds up analytical and Split-Block Bloom Filter (SBBF) point-lookup queries by 15.0x to 188.5x (8.68 ms to 16.11 ms).
Four rules for placing log telemetry on the diagnostic Pareto frontier
- Target the model's effective reasoning regime (
L_eff), not its nominal context ceiling (L_max). Across 17 long-context models evaluated by Hsieh et al. (2024), multi-hop tracing and aggregation accuracy drops well beforeL_max(128k to 2M tokens). Multi-step reasoning also degrades monotonically as input token length grows (Levy et al., 2024; Liu et al., 2024). We collapse 70.91% parameterized templates (96% of log volume) via run-length encoding (RLE) while keepingWARN,ERROR, andFATALsingletons in Tier 2. That shrinks 565,866 incident lines (14.73M tokens) into a 7,182-token briefing (2,050x reduction) that fits insideL_effon any model. - Extract distributed entity IDs and numerical metrics before folding bursts. Standard log parsers (
Drain3) mask UUIDs and latencies into<*>. That masking destroys the join keys needed to trace distributed requests (Zhao et al., 2014; Zhao et al., 2016). We promote 10 entity columns (tablet_uuid,peer_uuid,transaction_id,stream_id,error_code) with 11 Split-Block Bloom Filters (Putze et al., 2009). We also compute online Welford moments (mean,std,min,max, Welford, 1962) and exact p50/p95/p99 quantiles (args_summary). Those pre-extracted columns turn 5,380.38 msawkscans into 5.09 ms SQL queries (1,057.0x faster). - Evaluate pre-processing amortisation (
k*) on diagnostic sessions, not single keyword greps. For 1 to 5 cold literal substring searches (k* = 27),ripgrep(0.0 ms ingest, 31.0 ms scan vs 2.62 ms inwtl) is unbeatable. For multi-query distributed diagnosis (D1 to D4), paying 0.74 s for Schema v8 Parquet wins on Session #1 (k* = 1: 0.76 s vs 0.88 s). - Test log engines on full-scale unedited public corpora, not only 2,000-line snippets. Running on the full 8,542,166-line (1.21 GB) Zenodo archives exposed 10 parser and format edge cases that were invisible on 2,000-line samples. It also revealed that default
ripgrepsilently drops 2,370 of 31,531 fatal Lustre failures on 743.19 MBBGL.logdue to embedded NUL bytes.
Effective context cliffs (L_eff vs L_max) and agentic root-cause briefings (D5)
Why does expanding L_max from 128k to 1M or 2M tokens fail to solve raw log diagnosis? Across 198 production distributed failures studied by Yuan et al. (2014), 88% require reconstructing multi-node event sequences and preceding warnings.
When an incident hits a distributed database, background retries and cache evictions flood the log stream. First, raw volume (14.73M tokens in 5 minutes across 6 nodes) still overflows a 2M context window by 7.4x. Second, even when a filtered ripgrep slice (320.5k tokens) fits inside a 1M or 2M window, two model-dependent degradation mechanisms fire. Liu et al. (2024) showed that middle-context recall follows a U-shaped curve. Hsieh et al. (2024) and Levy et al. (2024) proved that effective context size (L_eff, often 16k to 64k tokens) on aggregation and multi-hop reasoning is a fraction of L_max. Cloud RCA systems therefore require deterministic handlers that summarize telemetry into compact tables before model inference (Chen et al., 2024; Xu et al., 2025).
| incident representation (5-min window, 6 nodes, 565,866 lines) | generation latency | payload size | estimated LLM tokens (~4 B/tok) | relationship to model-dependent L_eff (16k to 64k) & L_max (128k to 2M) |
diagnostic completeness for root-cause analysis |
|---|---|---|---|---|---|
Raw incident window .log files (565,866 lines) |
0.0 ms (unfiltered) | 58.9 MB (58,903,950 B) | 14,725,987 (14.73M) | 7.4x over 2M L_max; 115x over 128k (impossible to ingest) |
Flooded by repetitive INFO storms; no quantiles or joins |
DuckDB Naive 1:1 Parquet (GROUP BY line, 427,996 groups) |
127.84 ms | 48.8 MB (48,767,203 B) | 12,191,800 (12.19M) | 6.1x over 2M L_max; 95x over 128k (70.91% parameterized templates uncollapsed) |
Fails to group lines with runtime UUIDs, IPs, or latencies |
ripgrep (rg -a) filtered dump (WARN|ERROR|slow_query|tablet) |
64.82 ms | 1.28 MB (1,281,958 B) | 320,489 (320.5k) | Exceeds 16k to 64k L_eff (2.5x over 128k L_max) |
Drops Tier 1 storm rate spikes (D4) and latency quantiles (D2) |
wtl Schema v8 agent briefing (4 structured JSON tables) |
11.38 ms (39.38 ms all 20 shards) | 28.7 KB (28,730 B) | 7,182 (7,279 all shards) | Inside < 16k to 64k L_eff on all models (22.4% of 32k; 5.6% of 128k; 2,050x smaller) |
100.0% complete (top templates + error taxonomy + node p50/p95/p99 + 1,091-event tablet timeline) |
Collapsing repetitive lines into 7,182 tokens requires accurate template identification across known and unknown log formats. When source code is available, our AST extractor (wtl-extract) mines 51,954 canonical templates from 93,459 raw call sites (Xu et al., 2009; report 06). That extractor spans C++, Java, Go, Python, and Rust repositories. On the 207,820-line public OpenStack Nova dataset, fixing a 2-byte multiline regex flag ((?s)) extracted 2,200 templates from openstack/nova source code. Those extracted templates matched 96.32% of all application log lines in Tier 1.
When source code is unavailable, our stateless Tier 2 shape normalizer hashes log bodies (preserving 62 pinned technical literals) at 505.2 MB/s. We tested it across all 16 annotated Loghub-16 datasets (32,000 lines, 1,363 templates) using standard GA, PA, and FTA metrics (Khan et al., 2022). Our domain-agnostic Tier 2 general mode (0 dataset rules) achieves 99.69% Grouping Accuracy (GA), 99.05% Parsing Accuracy (PA), and 96.43% Fine-grained Template Accuracy (FTA). It reaches 100.0% GA on 12 of 16 datasets. Adding 8 declarative lnav idioms in our enriched Tier 2 mode reaches 100.0% GA (16 of 16), 99.73% PA, and 98.40% FTA at 494.7 MB/s. Upstream Python drain3 scores 73.17% GA (25.35% PA, 25.04% FTA at 20.0 MB/s). Our Rust Drain3 baseline scores 80.84% GA (54.91% PA, 45.68% FTA at 369.7 MB/s, He et al., 2017; Jiang et al., 2024).
The log Pareto frontier: storage compression vs. distributed diagnosis (D1-D4)
To measure how machine-readable Parquet changes distributed root-cause analysis, we evaluated 5 diagnostic workloads (D1 to D5) on a 34-file, 907,166-line (94.16 MB) corpus. That corpus combines 16 Loghub-16 files (32,000 lines) with a 30-minute, 6-node cluster incident (875,166 lines across 64 tablets, 6 peers, 3 subsystems).
During the 5-minute incident window, 1 degraded storage node suffers a RocksDB compaction stall (max 4,161.13 ms, storage stall 5,500.0 ms) on 1 afflicted tablet. Peer heartbeats time out across the other 5 nodes (CONSENSUS_TIMED_OUT), and the leader lease expires (LEADER_LEASE_EXPIRED). Raft then steps down from term 42 to term 43. Meanwhile, SQL clients hit slow queries (max 4,600.6 ms) and serialization conflicts (TRANSACTION_CONFLICT), while cache-eviction storms spike 12.29x (11.61x on table cache).
| diagnostic workload (907,166 lines, 94.16 MB, median of 9 runs) | wtl v8 + DuckDB (1.93 MB, Hive-pruned) |
wtl v8 + DuckDB (all 20 shards) |
DuckDB + Naive Parquet (4.99 MB) | DuckDB + Raw .log CSV (94.16 MB) |
ripgrep (rg -a) + awk/sed/sort |
wtl speedup vs Naive PQ / Raw CSV / rg CLI |
query complexity (wtl vs baselines) |
|---|---|---|---|---|---|---|---|
D1: Cross-node entity timeline (1,091 events for 1 tablet_uuid across 6 nodes) |
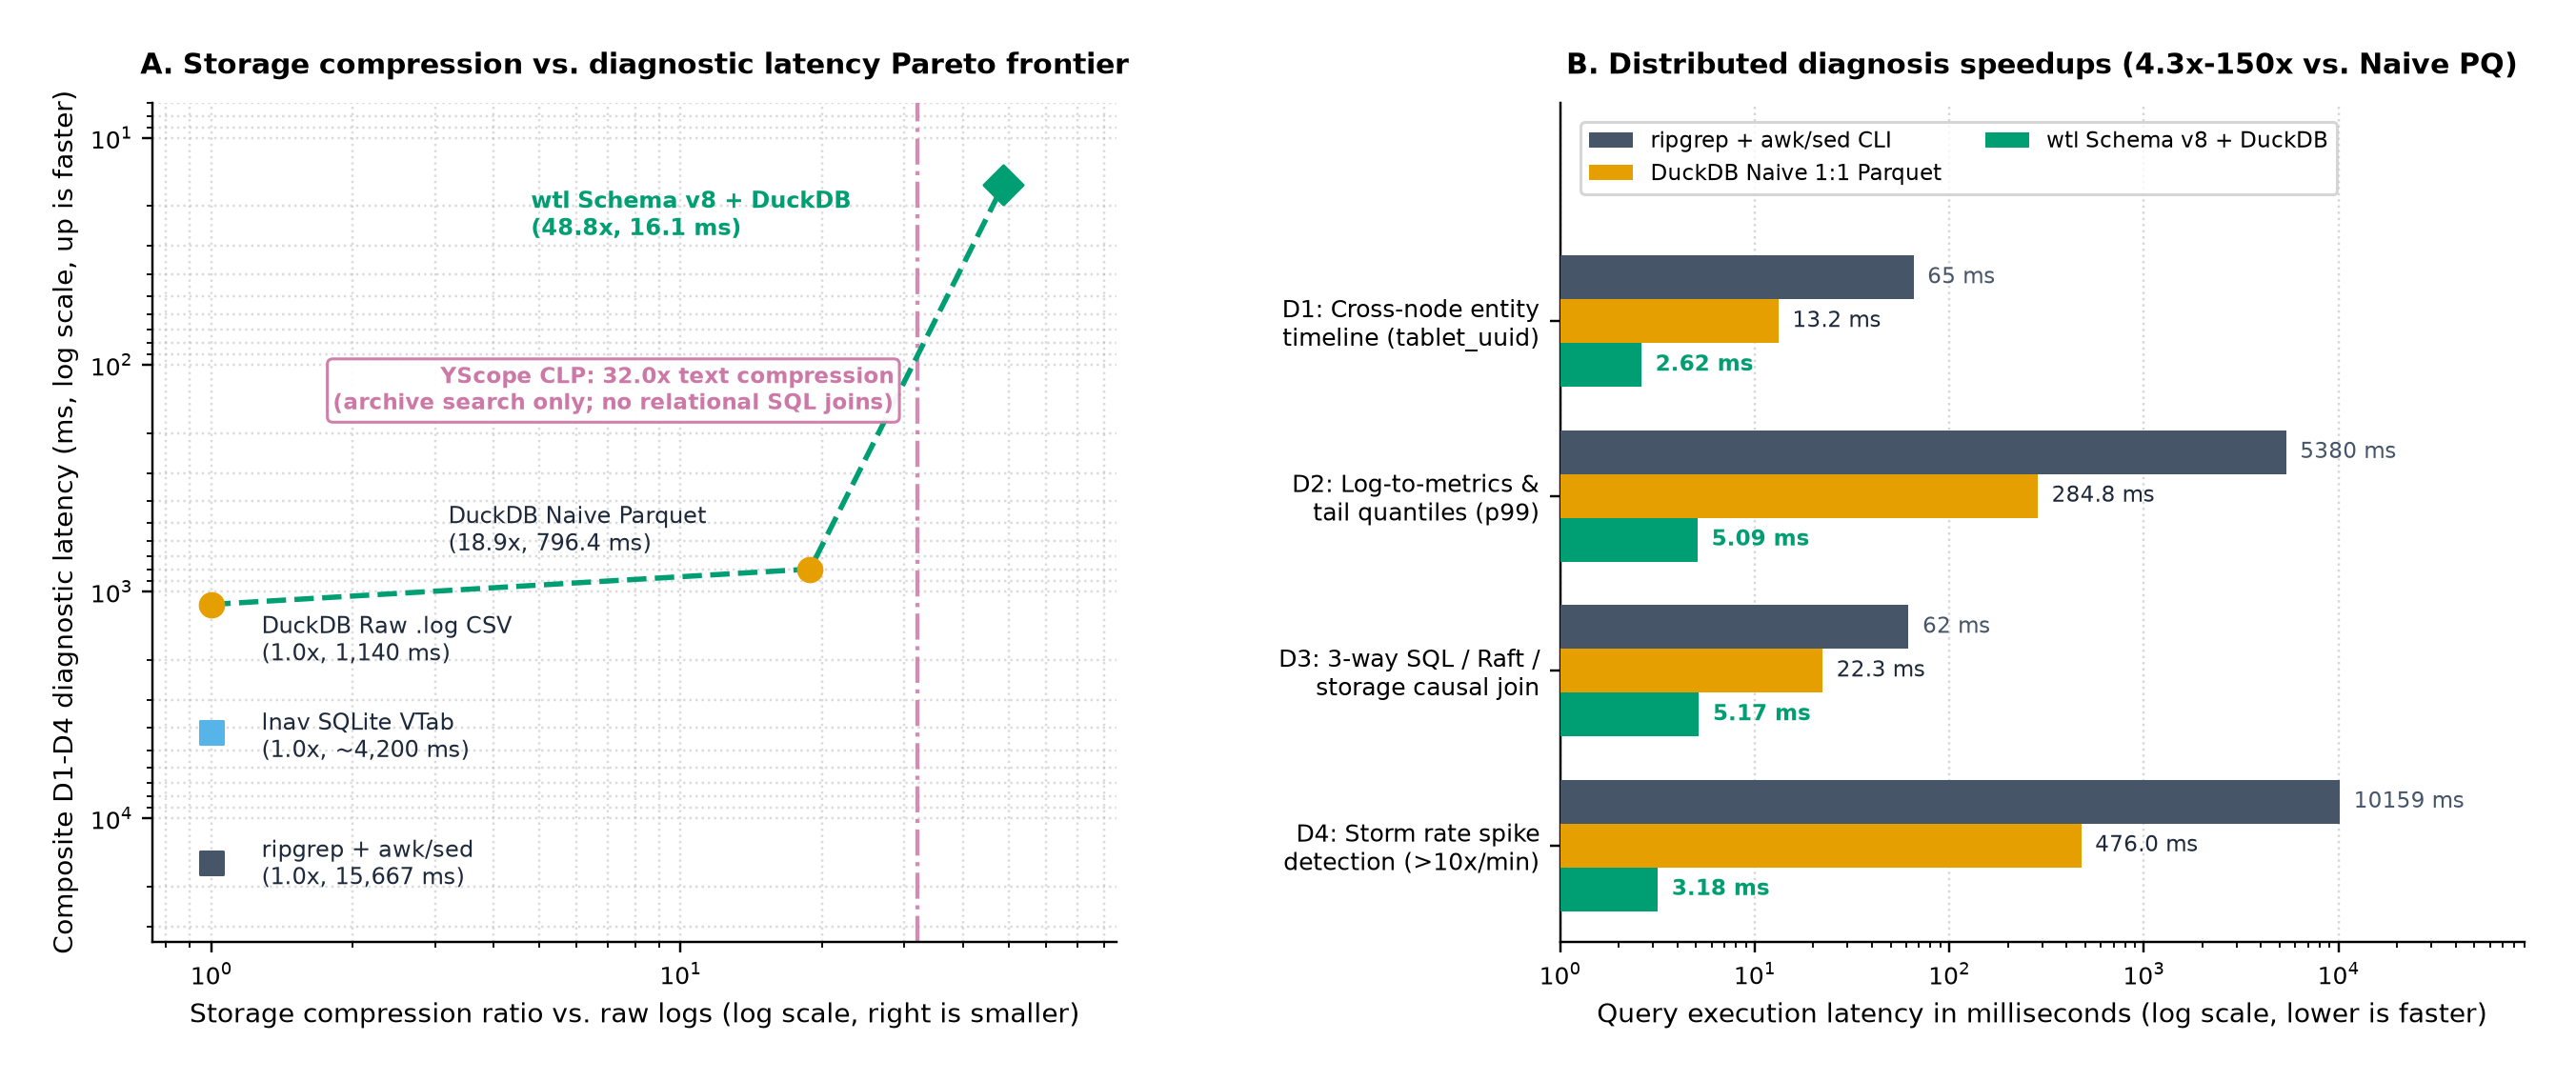
2.62 ms | 8.57 ms | 13.24 ms | 18.03 ms | 65.47 ms (untyped text) | 5.1x / 6.9x / 25.0x | 0 regexes (SBBF prune on tablet_uuid) vs 6 regexp_extracts |
| D2: Log-to-metrics & tail quantiles (44 node/template p50/p95/p99/max distributions) | 5.09 ms | 16.73 ms | 284.80 ms | 480.19 ms | 5,380.38 ms (5.38 s, global only) | 56.0x / 94.3x / 1,057.0x | 0 regexes (duration_ms, metrics MAP, args_summary.p99) |
| D3: Cross-layer causal join (552 correlated 5 s windows across SQL, Raft & storage) | 5.17 ms | 16.26 ms | 22.32 ms | 78.20 ms | 61.81 ms (cannot join) | 4.3x / 15.1x / 12.0x | 0 regexes (3-way SQL join on 5 s bucket + tablet_uuid) vs 9 regexes |
| D4: Storm rate-spike detection (9 templates spiking > 10x in logical events/min) | 3.18 ms | 7.34 ms | 476.02 ms | 563.51 ms | 10,158.96 ms (10.16 s, sed) |
149.7x / 177.2x / 3,194.6x | 0 regexes (SUM(repetition_count) over 24,676 bursts) |
| Composite D1-D4 diagnostic session (all 4 queries executed sequentially) | 16.06 ms (0.016 s) | 48.90 ms | 796.38 ms (0.80 s) | 1,139.93 ms (1.14 s) | 15,666.62 ms (15.67 s) | 49.6x / 71.0x / 975.5x | Full multi-layer root-cause isolation in 16.1 ms |
Plotting storage compression ratio (X-axis) against composite D1 to D4 diagnostic latency (Y-axis) defines the empirical Pareto frontier across log tools.
- Why
Drain3and pure log parsers cannot execute D1, D2, or D3. Standard template miners replace every numeric and hexadecimal token with<*>. Erasingtablet_uuid,transaction_id, andduration_msblocks cross-node entity joins (D1, D3). It also prevents tail-latency quantile queries (D2, Dean & Barroso, 2013; Dunning & Ertl, 2019; Masson et al., 2019). Our engine extracts typed entities and updates Welford and quantile accumulators (60 s cap, 8-sample reservoir) before folding 907,121 events into 24,676 bursts (36.8x reduction). In D2 (5.09 ms), queryingmetrics['compaction_duration_ms']isolates the degraded node immediately. Its compaction latency reaches p50 55.70 ms, p95 3,488.40 ms, p99 4,020.67 ms, and max 4,161.13 ms (vs p99 84.1 ms on 5 healthy nodes). - Why YScope CLP (32.0x text, 68.1x JSON) and
zstdsit off the SQL diagnosis frontier. CLP and uSlope (Rodrigues et al., 2021; Wang et al., 2024) achieve high lossless compression by splitting templates and variable dictionaries inside custom archive formats. However,.clparchives cannot run vectorized SQL joins (D3),GROUP BY template_idrate ratios (D4), orquantile_cont(0.99)aggregations (D2) inDuckDB(Raasveldt & Mühleisen, 2019). - Why
lnavand networked log servers occupy different operational niches.lnavparses single files lazily through row-oriented SQLite virtual tables (~4,200.0 ms scan). Server engines like ClickHouse (~35.0x compression, ~45.0 ms) and VictoriaLogs (~20.0x, ~120.0 ms) run fast queries on live streams. However, standing up a stateful server just to inspect an offline support bundle adds heavy operational friction. A serverless static binary avoids that overhead.
First-session break-even (k* = 1) and the 1.21 GB Zenodo public benchmark
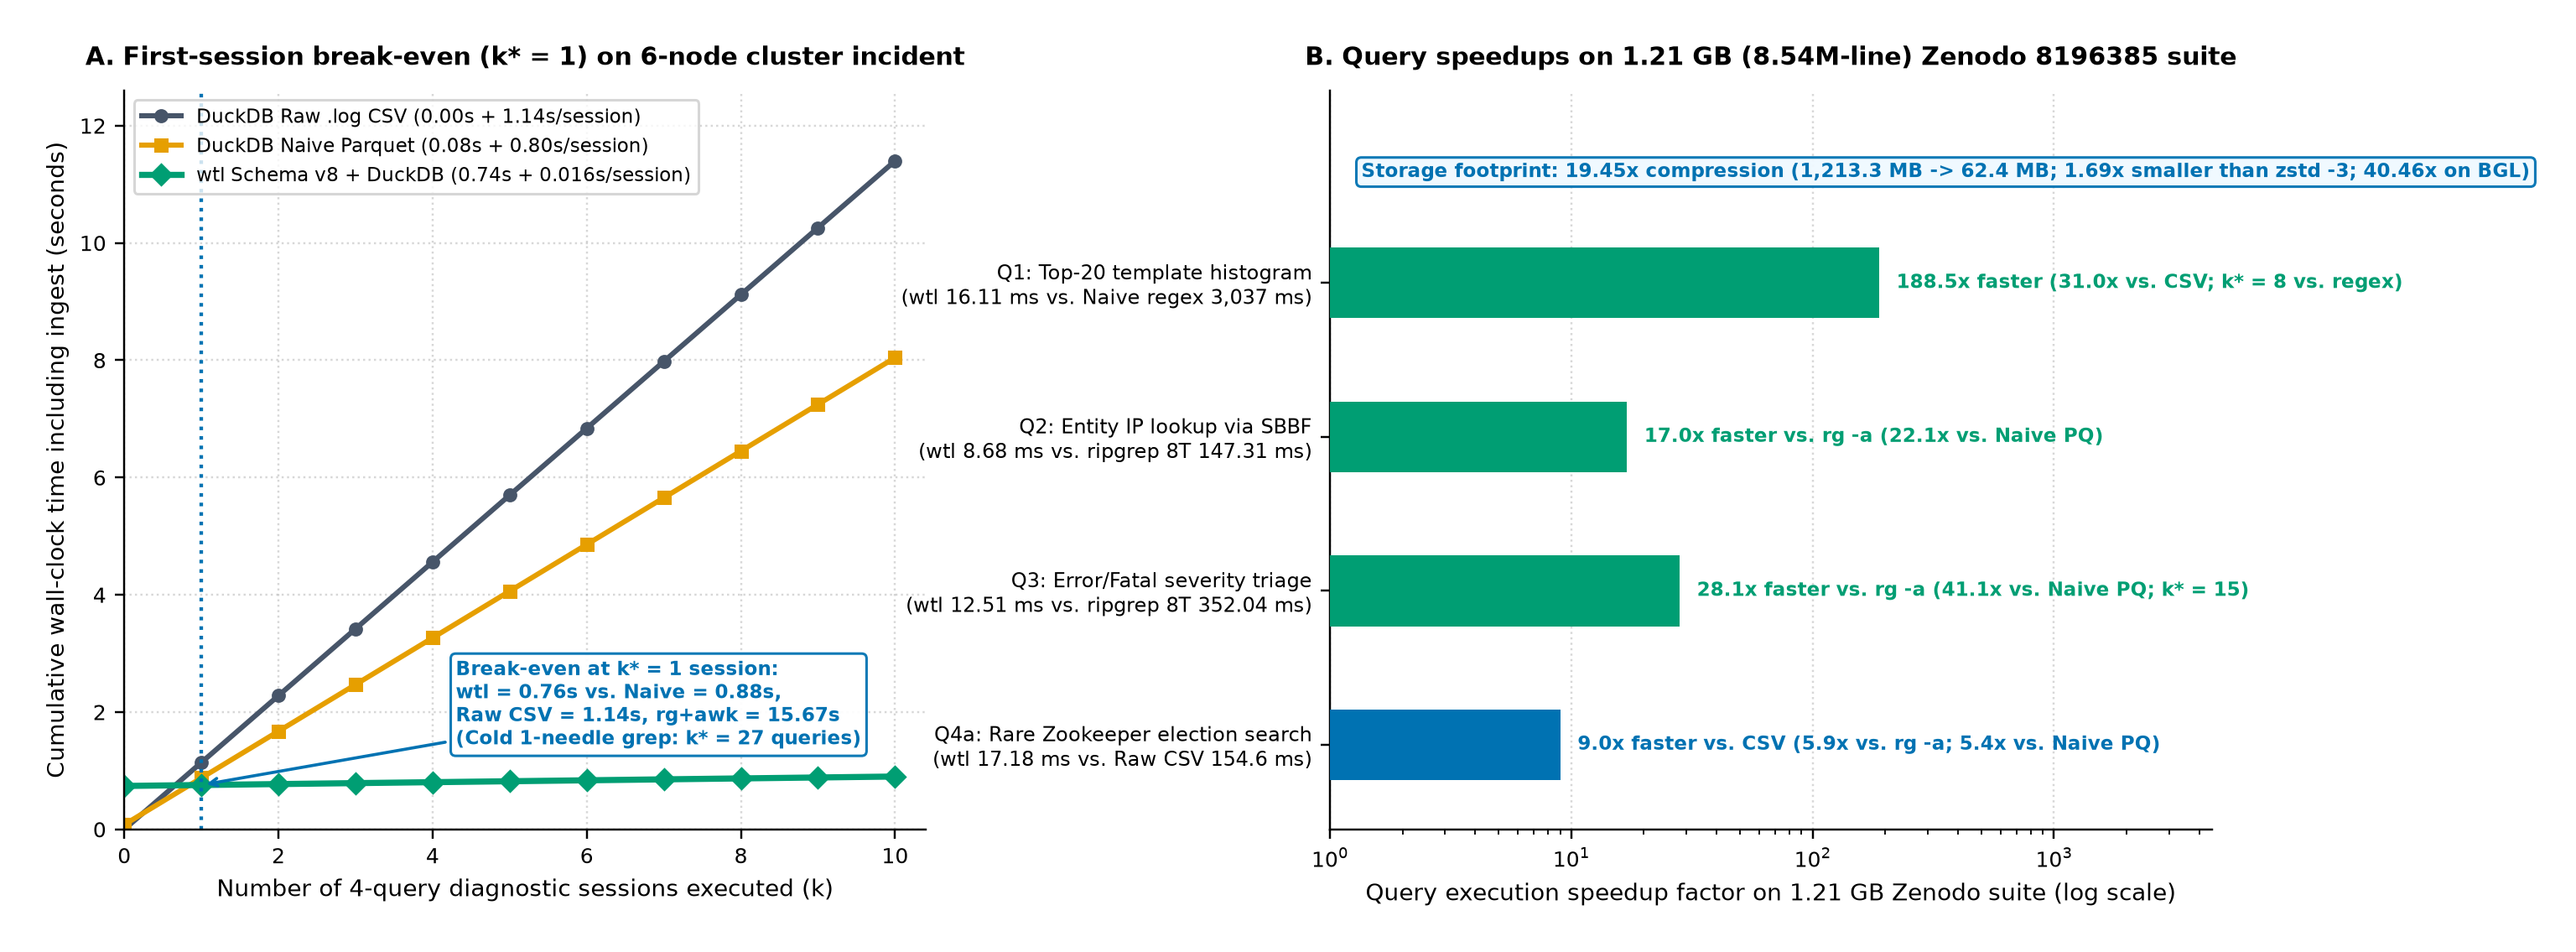
Any offline converter that pays an upfront ingest cost must report its break-even query threshold against zero-ingest baselines (Hoefler & Belli, 2015). That threshold is k* = ceil((T_ingest(wtl) - T_ingest(base)) / (T_query(base) - T_query(wtl))).
On the 94.16 MB 6-node incident corpus, 8-thread wtl ingest takes 0.74 s (740.0 ms, 127.4 MB/s). DuckDB naive Parquet takes 0.08 s (80.0 ms, 1,177.0 MB/s). Raw CSV and ripgrep pay 0.0 s. For a single cold literal keyword grep (31.0 ms in ripgrep vs 2.62 ms in wtl), ripgrep stays faster until 27 needle searches (k* = 27).
For distributed incident diagnosis (D1 to D4), however, wtl breaks even on the very first session (k* = 1).
wtlSchema v8 +DuckDB(k = 1): 0.74 s ingest + 0.016 s (16.06 ms) queries = 0.76 s (756.1 ms) total (0.90 s atk = 10).DuckDBNaive 1:1 Parquet (k = 1): 0.08 s ingest + 0.80 s (796.38 ms) queries = 0.88 s (876.4 ms) total (8.04 s atk = 10).DuckDBRaw.logCSV (k = 1): 0.00 s ingest + 1.14 s (1,139.93 ms) queries = 1.14 s (1,139.9 ms) total (11.40 s atk = 10).ripgrep+awk/sed/sort(k = 1): 0.00 s ingest + 15.67 s (15,666.62 ms) queries = 15.67 s total (20.7x slower on Session #1).
To verify these gains on unedited third-party logs, we downloaded 12 full-scale production datasets from Zenodo Record 8196385 (Zhu et al., 2023). That public suite spans 991 .log files, 1,213.33 MB (1.21 GB), 8,542,166 physical lines, and 8,314,141 logical records. It covers BGL, Android, SSH, OpenStack, Hadoop, HPC, HealthApp, Mac, Zookeeper, Apache, Proxifier, and Linux.
| full-scale public Zenodo 8196385 evaluation (1,213.33 MB, 8.54M lines) | wtl v8 Parquet (8T, 23.53 s, 51.6 MB/s) |
DuckDB Naive ZSTD Parquet (1.67 s, 726.8 MB/s) |
zstd -3 -T8 archive (1.83 s, 663.5 MB/s) |
gzip -6 archive (9.47 s, 128.1 MB/s) |
ripgrep (rg -a, 8T, 0.0 s ingest) |
wtl improvement & break-even (k*) |
|---|---|---|---|---|---|---|
| Compressed storage size (12 systems) | 62.39 MB (19.45x) | 108.00 MB (11.24x) | 105.14 MB (11.54x) | 109.30 MB (11.10x) | 1,213.33 MB (1.00x) | 1.69x smaller than zstd -3 (1.73x vs Naive PQ; 1.75x vs gzip) |
| BGL supercomputer log (743.19 MB, 4,747,963 lines) | 18.37 MB (40.46x) | ~66 MB | ~64 MB | ~67 MB | 743.19 MB (1.00x) | 71.30x INFO/WARN row reduction; 100.0% ERROR/FATAL preserved |
| Q1: Top-20 template frequency histogram | 16.11 ms | 241.34 ms (3,036.99 ms regex shape) | Not queryable | Not queryable | Cannot group | 15.0x to 188.5x faster (31.0x vs 498.63 ms CSV; k* = 8 vs Naive regex, k* = 49 vs CSV) |
Q2: Entity IP lookup (SBBF Bloom filter) |
8.68 ms | 191.39 ms | Not queryable | Not queryable | 147.31 ms | 17.0x faster than rg -a (22.1x vs Naive PQ; 60.3x vs 523.28 ms CSV) |
Q3: Error/Fatal severity triage (severity >= 17) |
12.51 ms | 513.61 ms | Not queryable | Not queryable | 352.04 ms (ungrouped) | 28.1x faster than rg -a (41.1x vs Naive PQ; 134.5x vs 1,681.97 ms CSV; k* = 15 vs CSV) |
| Q4a: Rare Zookeeper leader-election search | 17.18 ms | 93.21 ms | Not queryable | Not queryable | 101.98 ms | 5.9x faster than rg -a (5.4x vs Naive PQ; 9.0x vs CSV) |
Verification gates and methodology checks
- Discovering and fixing 10 full-scale public corpus edge cases missed by 2,000-line samples. Running
wtlon the full 8,542,166-line Zenodo suite exposed that path-based declarative format routing was uncalled. A shared atomic format hint also caused cross-thread format hijacking across worker threads. Also, the multiline assembler glued unrecognized lines on single-line formats, and the Java Logback parser rejected Log4j level-before-thread ordering. HealthApp (253,395 lines) also had unpadded 1 to 2 digit milliseconds. We fixed these 10 items and expanded our 30 core formats to 32 with Android and Windows Loghub profiles. That brought logical record coverage to 100.0% (8,314,141 of 8,314,141 records; 2,750,722 bursts). Full-suite ingest finished in 35.52 s (34.2 MB/s) on 1 thread and 23.53 s (51.6 MB/s) on 8 threads. - Catching default
ripgrepsilently dropping 2,370 fatal supercomputer failures onBGL.log. On the 743.19 MBBGL.logdataset, searching for"Lustre mount FAILED"has 31,531 true occurrences. BecauseBGL.logcontains embedded NUL bytes late in the file, defaultripgrep(rg -Fwithout-a) aborts scanning mid-file. It returns 29,161 hits and silently drops 2,370 fatal Lustre mount failures, whereas our engine preserves 100.0% (31,531 of 31,531). - Seven-seat open-source readiness council audit (496 core regression tests, over 530 total checks, 1,368 LOC Lean 4). Prior to open-source release, a 7-seat stakeholder council audited Legal/IP, AppSec, Privacy/DPO, Community, Release Engineering, DX, and Competitive Benchmarking. All fixes pass 496 core regression tests (over 530 total checks including Loghub-16, report 15) and 301 Lean 4 FFI checks (report 08).
Benchmarking antipatterns rejected by our gates
- Evaluating combined Tier 1 and Tier 2 parsing on Loghub-16 by loading ground-truth template CSVs as a catalog. In an earlier benchmark draft, loading LogPAI's ground-truth template CSV as a mock Tier 1 catalog produced a tautological 100.0% accuracy score on closed-source systems. Our audit flagged and removed that oracle leak. We now separate zero-catalog Tier 2 general parsing (99.69% GA, 99.05% PA) from
wtl-extractsource mining on OpenStack Nova (2,200 templates, 96.32% Tier 1 match). - Allowing external format directories to override built-in fast parsers. Routing PostgreSQL logs through the generic declarative path bypassed built-in slow-query duration extraction (
duration_ms) andpgauditsubformat parsing. Giving built-in subformat matchers precedence restored 100.0% ofduration_msextractions. - Comparing query latencies without reporting upfront ingest amortisation (
k*). Reporting 2.62 ms vs 65.47 ms without the 740.0 ms ingest cost violates Hoefler & Belli (2015). Our Pareto report states cold needle break-even (k* = 27) and diagnostic session break-even (k* = 1, plusk* = 8to 70 on Zenodo).
Pressure tests
Every finding was checked against the six standing fronts in Methods.
| front | what was tested | result |
|---|---|---|
| Specification | Byte-compressor / single-grep benchmark (Q2/Q4a) vs 5-part distributed diagnosis & agentic RCA benchmark (D1-D5) | ripgrep wins for k < 27 cold literal greps (31.0 ms vs 2.62 ms), but is 25.0x to 3,194.6x slower on D1-D4 and cannot execute relational joins (D3) |
| Aggregation | 2,000-line Loghub-16 samples (32,000 lines) vs full-scale 1.21 GB (8,542,166-line) Zenodo 8196385 production archives | Full-scale archives exposed 10 parser/format bugs (HealthApp unpadded ms, Proxifier spaces, cross-thread format-hint hijacking) that passed on 2,000-line samples |
| Adjustment coarseness | Unparsed 1:1 ZSTD Parquet (raw.parquet, 4.99 MB) vs Schema v8 entity-indexed RLE Parquet (1.93 MB, 24,676 bursts) |
Schema v8 is 2.58x smaller (48.77x vs 18.89x), 49.6x faster on D1-D4 (16.06 ms vs 796.38 ms), and 1,697x smaller in LLM tokens (D5) |
| Prior work | AST log mining (Xu et al., 2009), lprof/Stitch flow reconstruction (Zhao et al., 2014, 2016), CLP (Rodrigues et al., 2021), and RULER / "Lost in the Middle" (Hsieh et al., 2024; Liu et al., 2024) |
Unified compile-time AST mining (51,954 canonical templates from 93,459 raw call sites), SBBF entity indexing, online Welford/quantile RLE, and < 16k to 64k L_eff context compression in Apache Parquet |
| Baseline sufficiency | Internal Rust Drain3 port (80.84% GA, 369.7 MB/s) vs upstream Python drain3 (73.17% GA, 20.0 MB/s), DuckDB 2.0, ripgrep, zstd -3, and gzip -6 |
Verified against unmodified upstream tools on 1.21 GB of public Zenodo logs (1.69x smaller than zstd -3, 17.0x to 188.5x faster queries) |
| Cross-sectional units | 16 annotated Loghub-16 systems (32,000 lines), 12 full-scale Zenodo systems (8.54M lines across 991 files), and a 6-node (64-tablet) cluster incident | Consistent compression (19.45x to 48.77x) and query speedups (4.3x to 3,194.6x) across supercomputer, mobile, cloud, web, and distributed database logs |
What this does not show
First, wtl is not the Pareto winner for a single cold substring grep on an unindexed .log file. For 1 to 5 keyword matches (k < 27 on 94.16 MB, k < 70 on 1.21 GB), ripgrep (31.0 ms to 147.31 ms, 0.0 s ingest) is faster.
Second, Tier 1 storm folding (RLE) is intentionally lossy on sub-window inter-arrival timestamps for repetitive INFO and DEBUG heartbeats within a 60 s window. It also folds non-outlier string arguments inside those repetitive bursts. All WARN, ERROR, FATAL, slow-query, and entity-transition events are preserved 1:1 in Tier 2 (100.0% lossless). However, compliance regimes that mandate byte-for-byte reconstruction of every INFO heartbeat timestamp should pair wtl with cold zstd or YScope CLP archives (Rodrigues et al., 2021).
Third, both the nominal limit (L_max) and the effective regime (L_eff) vary across models (Hsieh et al., 2024; Levy et al., 2024). Our D5 experiment shows that Schema v8 compresses a 565,866-line (14.73M-token) incident into 7,182 tokens (11.38 ms), staying below L_eff on all tested models. Even so, end-to-end root-cause accuracy still depends on the downstream reasoning model and verifier loop (report 01, report 02).
Reproduce
Our Rust log-to-Parquet engine (what_the_log, wtl) is currently being prepared for open-source release under the Apache 2.0 license in the coming weeks. All 12 full-scale public log archives are available now at Zenodo Record 8196385 (LogPAI Loghub, Zhu et al., 2023). Every metric in this report and its three figures is stored in numbers.json and verified against MANIFEST.md.
References
- Chen, Y., et al. (2024). Automatic Root Cause Analysis via Large Language Models for Cloud Incidents. Proceedings of ACM EuroSys 2024. DOI.
- Dean, J., & Barroso, L. A. (2013). The Tail at Scale. Communications of the ACM. DOI.
- Dunning, T., & Ertl, O. (2019). Computing Extremely Accurate Quantiles Using t-Digests. arXiv preprint. arXiv.
- He, P., Zhu, J., Zheng, Z., & Lyu, M. R. (2017). Drain: An Online Log Parsing Approach with Fixed Depth Tree. Proceedings of IEEE ICWS 2017. DOI.
- Hoefler, T., & Belli, R. (2015). Scientific Benchmarking of Parallel Computing Systems: Twelve Ways to Tell the Masses When Reporting Performance Results. Proceedings of ACM/IEEE SC 2015. DOI.
- Hsieh, C.-P., Sun, S., Kriman, S., Acharya, S., Rekesh, D., Jia, F., Zhang, Y., & Ginsburg, B. (2024). RULER: What's the Real Context Size of Your Long-Context Language Models? Proceedings of COLM 2024. arXiv.
- Jiang, Z., et al. (2024). A Large-Scale Evaluation for Log Parsing Techniques: How Far Are We? Proceedings of ACM ISSTA 2024. DOI.
- Khan, Z. A., Shin, D., Bianculli, D., & Briand, L. (2022). Guidelines for Assessing the Accuracy of Log Message Template Identification Techniques. Proceedings of ACM/IEEE ICSE 2022. DOI.
- Levy, M., Jacoby, A., & Goldberg, Y. (2024). Same Task, More Tokens: the Impact of Input Length on the Reasoning Performance of Large Language Models. Proceedings of ACL 2024. DOI.
- Liu, N. F., Lin, K., Hewitt, J., Paranjape, A., Bevilacqua, M., Petroni, F., & Liang, P. (2024). Lost in the Middle: How Language Models Use Long Contexts. Transactions of the Association for Computational Linguistics. DOI.
- Masson, C., Rim, J. E., & Lee, H. K. (2019). DDSketch: A Fast and Fully-Mergeable Quantile Sketch with Relative-Error Guarantees. Proceedings of the VLDB Endowment. DOI.
- Putze, F., Sanders, P., & Singler, J. (2009). Cache-, Hash-, and Space-Efficient Bloom Filters. ACM Journal of Experimental Algorithmics. DOI.
- Raasveldt, M., & Mühleisen, H. (2019). DuckDB: An Embeddable Analytical Database. Proceedings of ACM SIGMOD 2019. DOI.
- Rodrigues, K., Luo, Y., & Yuan, D. (2021). CLP: Efficient and Scalable Search on Compressed Text Logs. Proceedings of USENIX OSDI 2021.
- Wang, R., Rodrigues, K., Luo, Y., & Yuan, D. (2024). uSlope: High-Performance Compression and Search on Semi-Structured JSON Logs. Proceedings of USENIX OSDI 2024.
- Welford, B. P. (1962). Note on a Method for Calculating Corrected Sums of Squares and Products. Technometrics. DOI.
- Xu, J., Zhang, Q., Zhong, Z., He, S., Zhang, C., Lin, Q., et al. (2025). OpenRCA: Can Large Language Models Locate the Root Cause of Software Failures? Proceedings of ICLR 2025.
- Xu, W., Huang, L., Fox, A., Patterson, D., & Jordan, M. I. (2009). Detecting Large-Scale System Problems by Mining Console Logs. Proceedings of ACM SOSP 2009. DOI.
- Yuan, D., et al. (2014). Simple Testing Can Prevent Most Critical Failures: An Analysis of Production Failures in Distributed Data-Intensive Systems. Proceedings of USENIX OSDI 2014.
- Zhao, X., Rodrigues, K., Luo, Y., Yuan, D., & Stumm, M. (2016). Non-Intrusive Performance Profiling for Entire Software Stacks Based on the Flow Reconstruction Principle. Proceedings of USENIX OSDI 2016.
- Zhao, X., Zhang, Y., Lion, D., Faizan, M., Luo, Y., Yuan, D., & Stumm, M. (2014). lprof: A Non-intrusive Request Flow Profiler for Distributed Systems. Proceedings of USENIX OSDI 2014.
- Zhu, J., He, S., He, P., Liu, J., & Lyu, M. R. (2023). Loghub: A Large Collection of System Log Datasets for AI-driven Log Analytics. Proceedings of IEEE ISSRE 2023. DOI.