28 pre-registered cloud A/B tests on our Rust log parser
- Published
- Data
- 28 cloud A/B experiments, 32 anonymized diagnostic bundles (0.39 GB to 1.415 TB unpacked), single-VM palindromic schedules
- Figures
- 4
The claim
An AI agent that diagnoses database incidents cannot read raw support bundles. One incident archive reaches 103.9 GB compressed and 1.415 TB of unpacked text across 2.439 billion log lines. To make those archives queryable in milliseconds, we built what_the_log (wtl), a 27.6k-line Rust log-to-Parquet engine. It uses 51,954 source-mined templates and statistical run-length encoding to cut LLM prompt tokens by 74.2x to 88.4x.
Scaling the engine to multi-terabyte archives required eliminating tail timeouts and memory spikes. On archives of 30 GB or more, the v0 baseline timed out on 77.8% to 100.0% of runs after 4.8 to 12 hours. Over two weeks, we executed 28 pre-registered differential experiments on Google Cloud Batch. We committed pass criteria to Git before each test, paired runs on a single VM, and verified a 128-bit multiset digest.
The shipped code runs 2.24x faster on small and mid-sized bundles and 3.36x to 6.80x faster on 10 GB bundles. It finishes a 33.6 GB bundle 8.06x faster and completes the 1.415 TB bundle in 61.5 minutes. It also cuts peak memory on fat Java logs by 3.2x to 8.7x and shrinks Parquet output by 48.5% to 56.2%.
Beyond the speedup, the core engineering contribution is what the verification protocol filtered out before production release. Four LLM code-audit agents flagged a mutex that consumed under 0.4% of CPU in a 500 Hz flamegraph. Identical binaries run across two VMs of the same cloud machine type varied by 43.7% to 2.19x. Nine candidate optimization arms were rejected by our pre-registered memory, latency, or correctness gates before shipping.
I lead Applied AI and Support at Yugabyte. The what_the_log engine feeds the diagnostic agent studied in report 01 and report 02. We are preparing the engine for open-source release under the Apache 2.0 license. The method below applies to any team optimizing data pipelines with or without AI assistance.
What to check this week
- Audit your Parquet Bloom filter defaults. Default
parquet-rssettings size every Split-Block Bloom Filter for 1,000,000 distinct values, or 1.05 MiB per column per row group. Across 11 columns, Bloom bitsets ate 46.3% of our Silver bytes until right-sizing cut Bloom bytes by 94.7%. - Stop comparing unpaired cloud VMs. Running the same binary on the same bundle across two
e2VMs varied by 43.7% to 2.19x. Pair control and treatment on one VM in a palindromicABBAorABCDDCBAschedule (Abedi & Brecht, 2017), where within-VM drift is 1.0% or less. - Run an A/A test before trusting file hashes. Two runs of our unmodified baseline binary produced different Parquet files because thread scheduling shifted file rotation by 69 rows. Gate on an order-insensitive 128-bit multiset row digest, not
sha256sum.
The production inventory
Across 28 pre-registered cloud A/B arms on 32 diagnostic bundles, single-VM palindromic schedules separated real speedups from cloud noise and LLM audit mirages. Nine candidate arms failed their pre-registered memory, liveness, storage, or unknown-line gates and were rejected before shipping.
Before touching the code, we audited the full production inventory. It holds 1,626 compressed support bundles (3,898.1 GB, or 3.90 TiB) across 945 customer cases. Historical batch logs covered 2,381 jobs (2,112 succeeded, 268 failed at 11.3%), burning 3,821 billed vCPU-hours and 3,706 runtime vCPU-hours. All bundle processing runs inside our isolated, access-controlled support boundary on ephemeral encrypted scratch storage, and B01 through B30 are anonymized benchmark identifiers.
| Tier | Cloud VM | Compressed size | Share of bundles (1,626) | Share of compute (3,821 vCPU-h) | Median wall | p90 wall | Baseline failure rate |
|---|---|---|---|---|---|---|---|
| Small | e2-standard-4 (16 GiB) |
< 1 GB | 64.0% (1,041) | 9.2% (13.8% billed) | 173 s | 706 s | 4.1% |
| Medium | e2-standard-8 (32 GiB) |
1 to 8 GB | 29.8% (484) | 54.4% (53.0% billed) | 949 s | 2,868 s | 9.8% |
| Large | e2-standard-16 (64 GiB) |
8 to 30 GB | 5.0% (81) | 27.9% (27.0% billed) | 2,821 s | 8,234 s | 22.4% |
| Stress | e2/c3-highmem-16/22 (128 to 176 GiB) |
30 to 103.9 GB | 1.2% (20) | 8.5% (6.2% billed) | 11,921 s | > 17,280 s | 77.8% to 100.0% |
Small bundles under 1 GB make up 64.0% of all archives (median 471 MB, p10 18.8 MB, p99 33.9 GB). Yet they use only 9.2% of runtime vCPU-hours. Medium and large bundles (1 to 30 GB) are 34.8% of the archives (565 bundles) and consume 82.3% of all vCPU-hours. Uniform sampling over-weights trivial bundles by nearly 7x.
Benchmarking LLM static code audits and cross-VM cloud variance against 500 Hz flamegraphs
We first ran four parallel LLM sub-agents to audit the workspace. They found 142k lines (461 files) of dead v0 proof-of-concept code, which we deleted. Then they ranked five performance hypotheses by reading the Rust source.
We tested their claims with samply at 500 Hz (2 ms interval, 225,196 on-CPU samples, 8 threads) on B01. Bundle B01 is a 7.0 GB unpacked archive with 52.0 million logical lines and 14.0 million bursts (3.7x compression, 1.4 GB Parquet). We also profiled a 620 MB single-node subset at 1,000 Hz.
| Bottleneck hypothesis | Source | Measured 500 Hz profile on B01 (220.5 s wall) | Verdict |
|---|---|---|---|
Mutex<ShardWriter>::lock contention |
LLM audit (#1 suspect) | < 0.4% lock wait (0% on glog and YBA paths) | Rejected |
_unknowns cluster keys (400 strings) |
LLM audit | 0.0% of CPU and heap on 99.5%-matched bundle | Rejected |
run_pipelined 8,192-line batch memory |
LLM audit | Backwards: 256 MiB compressed floor blocked pipelining | Rejected |
Gzip decompression (flate2 / zlib-rs) |
Engineer intuition | 4.3 s of 140 s (3.5%); zlib-rs 0.6.8 burned +22% CPU |
Rejected |
ShardSort::spill under shard lock |
LLM audit (#2 suspect) | 8.5% inclusive CPU (real, but 4x smaller than merge tail) | Downgraded |
body_normalize copy and offset map |
LLM audit | 12.1% self CPU (33.9% of parse_body) |
Confirmed |
SmallVec byte-wise iterator clones |
Missed by LLM audit | 11.1% CPU (8.3% Cloned::next + 2.8% extend) |
Profile-found |
YBA_STD_RE greedy (?P<body>[\s\S]*)$ |
Missed by LLM audit | 13.8% total CPU (53.4% on the 5.56 GB YBA straggler) | Profile-found |
Serial close_all merge (49 shards) |
Under-ranked (#4) | 35.9% of wall time (79.1 s on 1 core; 7 cores idle) | #1 bottleneck |
Four of the static hypotheses failed. The profile showed three phases across the 220.5 s run (3.4 of 8 cores used on average). From 0 to 70 s, all 8 cores parsed logs. Within that phase, parse_body took 35.7% of CPU (80,349 samples) and malloc/free took 8.7% inclusive (19,585 samples). From 70 to 150 s, 5 cores sat idle while PikeVM chewed on one 5.56 GB YBA file (459 MB .gz). From 150 to 220 s, 7 cores sat idle while one thread merged 49 shards serially for 79.1 s.
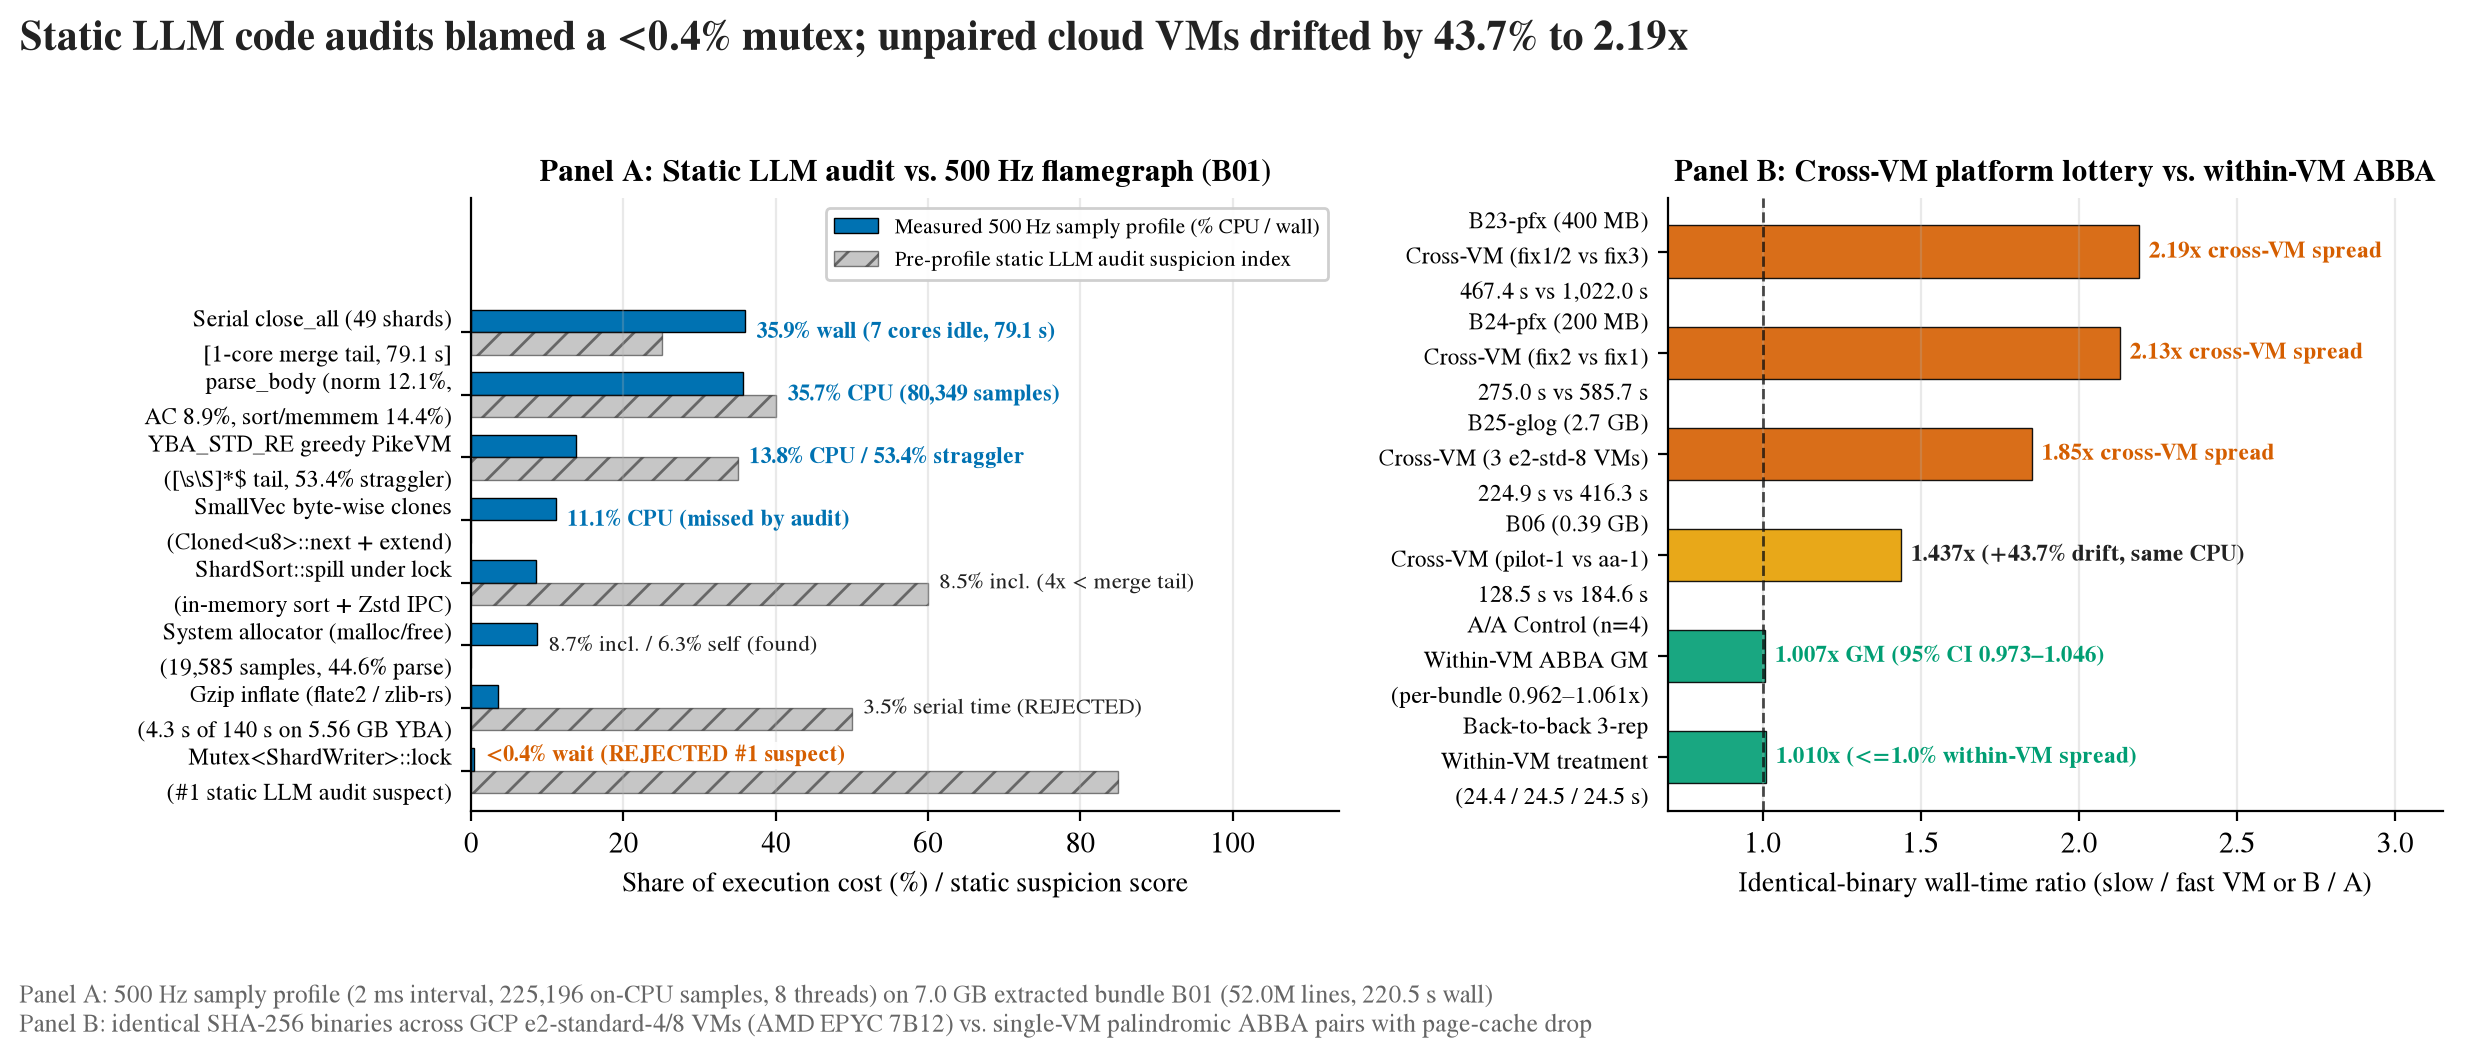
Unpaired cloud VMs introduced comparable measurement distortion. We ran the unmodified baseline binary on the same 0.39 GB bundle (B06, 233.1 MB Parquet, 1,808,500 rows) across two e2-standard-4 VMs. Both VMs reported AMD EPYC 7B12 in us-central1, yet one took 128.5 s and the other took 184.6 s (+43.7% drift). We saw even larger spreads on three deterministic prefixes (B23-pfx 400 MB, B24-pfx 200 MB, and B25-glog 2.7 GB). Across e2-standard-8 VMs, the baseline binary varied by 2.19x (467.4 s vs 1,022.0 s) and 2.13x (275.0 s vs 585.7 s). On B25-glog, it varied by 1.85x (224.9 s vs 416.3 s). On any single VM, three back-to-back runs varied by 1.0% or less (24.4, 24.5, and 24.5 s).
The harness: palindromic schedules and multiset digests
To isolate algorithmic gains from cloud hardware variance, we built a locked benchmark harness (bench/gcp_lab) under a $150 budget cap (actual spend was $68). Every candidate required a Git-committed pre-registration record (docs/AB-*.md) before confirmatory runs.
Each job boots one isolated VM, unpacks the bundle once onto local scratch disk, and checks binary SHA-256 hashes. Before every slot, the runner executes sync; echo 3 > /proc/sys/vm/drop_caches. Arms run back to back on that same VM in a palindromic schedule. Two-arm tests use ABBA (mean slot 2.5), 3-arm tests use ABCCBA (mean slot 3.5), and 4-arm factorials use ABCDDCBA (mean slot 4.5). Linear thermal or noisy-neighbor drift cancels out to first order.
Running an A/A test of the baseline binary against a renamed copy of itself across 4 bundles set our noise floor. Per-bundle wall ratios ranged from 0.962x to 1.061x (±5% to 7%). The geometric mean (GM) was 1.007x (95% bootstrap interval 0.973 to 1.046 across 10,000 resamples; CPU 1.002x; peak RSS 0.984x). Single-bundle shifts under 6% are noise.
The A/A run also demonstrated why parallel columnar engines require multiset equivalence rather than byte-level sha256sum file checks (C1b). Parallel workers push bursts with equal (first_ts, tier) keys in scheduling order, which alters compressed page sizes slightly. Because glog rotates from data_1.parquet to data_2.parquet by byte size, that page difference shifted the file rollover boundary by 69 rows on B04. Run 1 wrote 4,608,006 and 43,517 rows, while Run 2 wrote 4,608,075 and 43,448 rows (total 4,651,523 rows identical). And the 100-row _unknowns.parquet sidecar tie-broke over a randomly seeded HashMap.
We replaced file hashes with c1, an order-insensitive 128-bit multiset digest. For each log_type directory, DuckDB checks exact row counts, the 128-bit modular sum (SUM(hash(r)::HUGEINT)), and the bitwise XOR (BIT_XOR(hash(r))).
Five optimization rounds and pre-registered gate enforcement
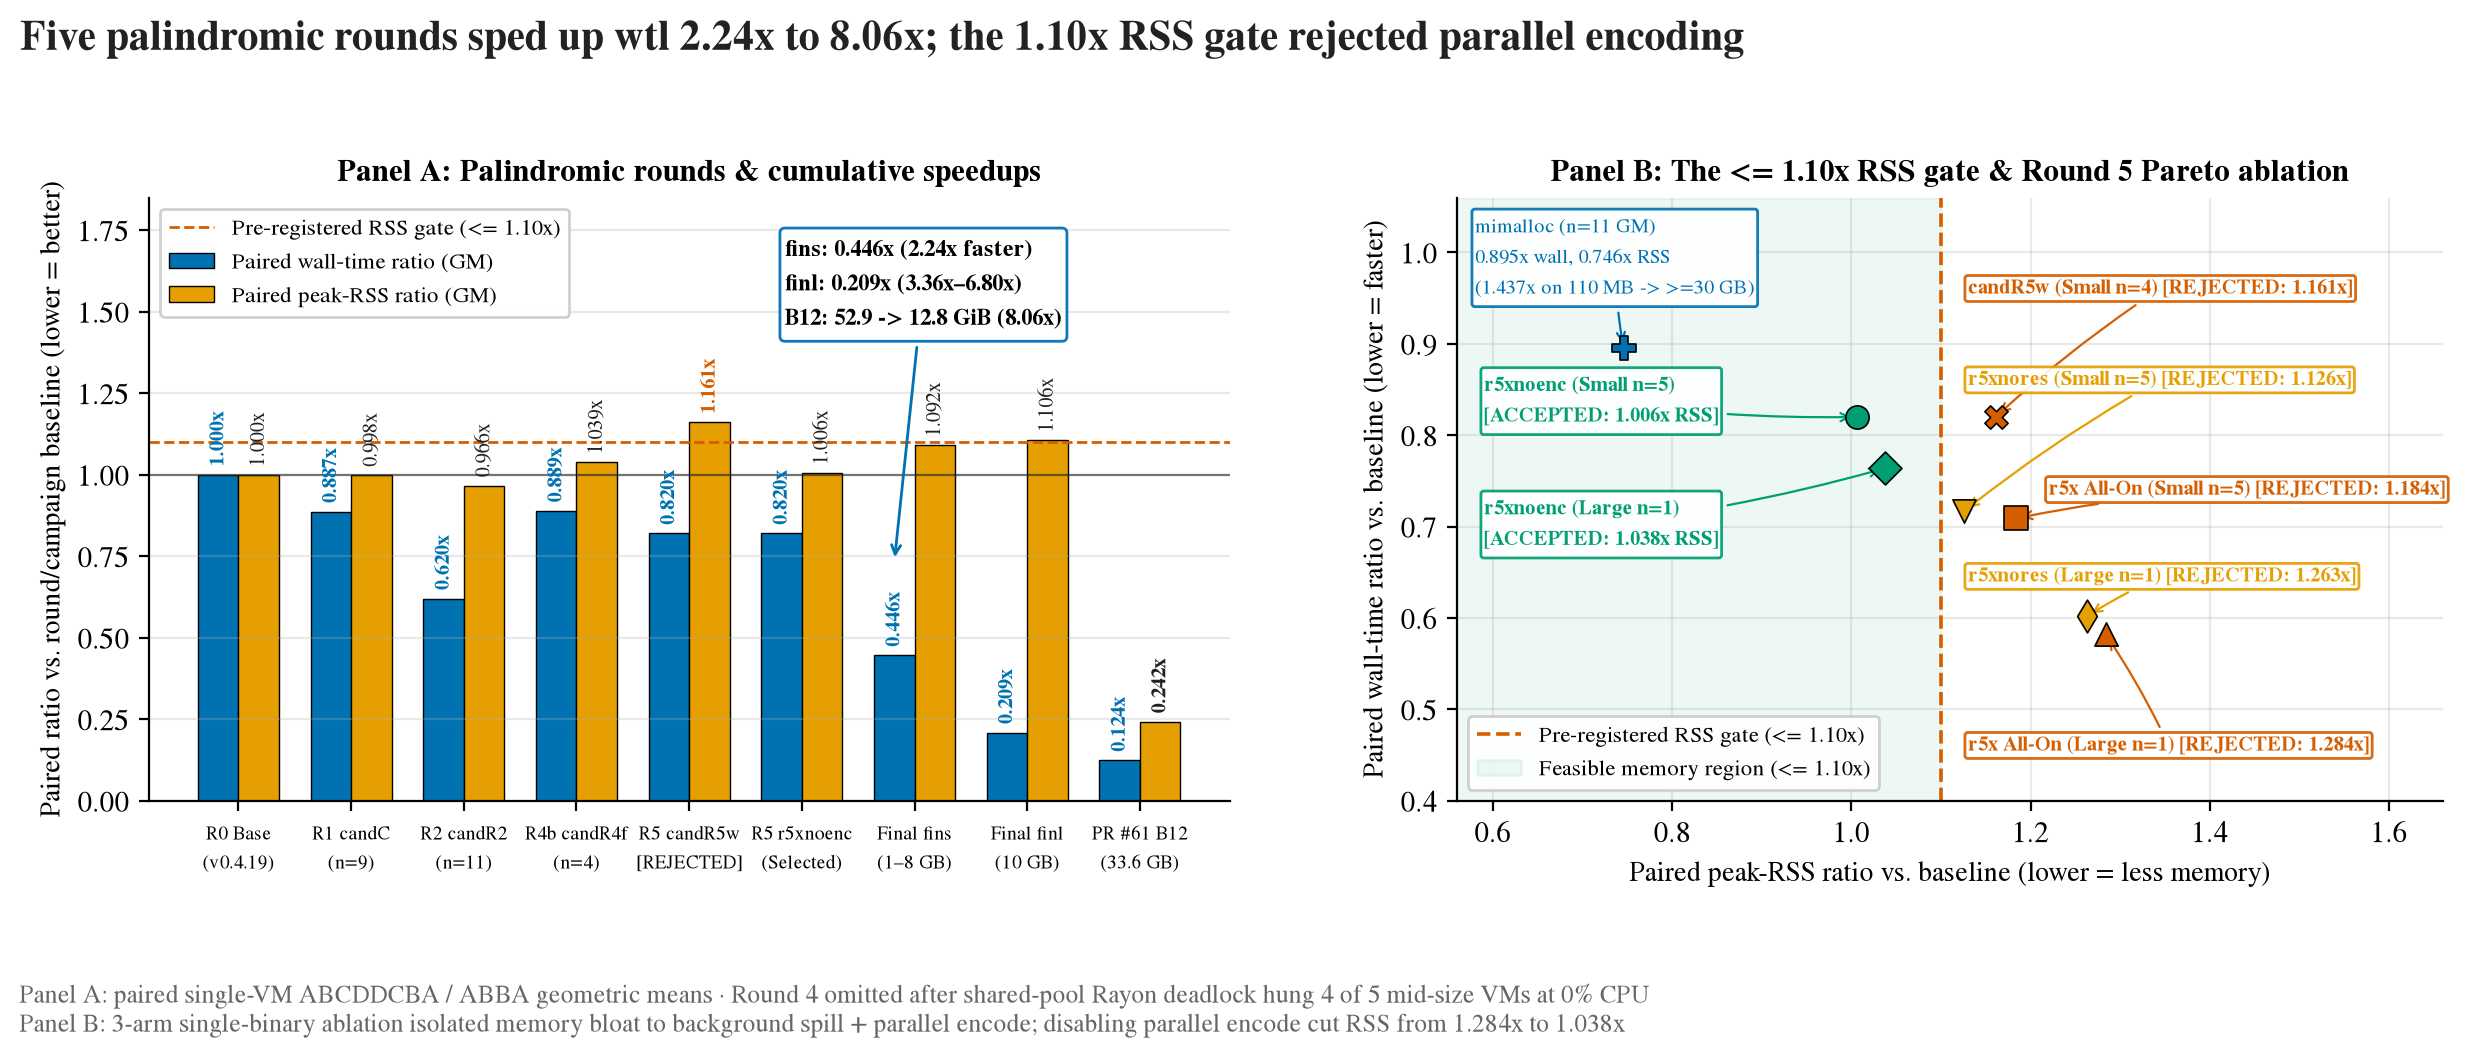
Round 1 (ABCDDCBA, 9 bundles) produced two wall-gate failures and a neutral cap. Arm candA (parallel shard close on Rayon) hit 0.957x wall GM (95% CI 0.923 to 0.987) and failed its <= 0.80x gate. Small bundles had short merge tails. Arm candB stripped the greedy [\s\S]*$ regex tail, capped body_normalize at 64 KiB, and used slice copies (0.858x wall GM, 0.873x CPU GM). Combined candC hit 0.887x wall GM and failed its <= 0.85x gate (and scored 1.023x wall on the 5-bundle Pilot-1 set). Leave-one-out analysis showed why. On YBA-heavy B02, candC ran 2.60x faster (0.385x wall, 0.428x CPU). Without B02, its wall GM was 0.985x (CPU 1.004x). A re-profile (N03) also showed the 64 KiB body_normalize cap was neutral on typical bundles (normalize_prefix share rose from 12.2% to 15.8%). Mean line length is ~300 B and 99.75% of lines are under 4 KiB. We also rejected R01 (UInt8 to Int32 cast avoidance, < 1.8% total CPU) because it altered the Parquet schema.
Round 2 (ABCDDCBA, 11 bundles) bought 38.0% wall time with idle cores. Instrumentation showed that 178 to 255 MB uncompressed glog cascades fell below the 256 MiB pipelining floor and ran on 1 thread. Arm candP lowered the cutoff to 16 MiB of estimated uncompressed bytes (counting .gz at 8x). It also gated the UUID regex behind a 32-hex-byte check and cached field extractors via OnceLock (0.693x wall, 1.284x CPU). Arm candM coalesced 64-way merge slices into 8,192-row batches (0.914x wall). Together they formed candR2. Across 11 bundles, candR2 cut wall time to 0.620x (1.61x faster; 0.391x to 0.581x on 8 to 30 GB bundles) and kept RSS at 0.966x. It burned +24.2% more CPU-seconds (1.242x) on formerly idle cores. Because Cloud Batch bills per VM wall-second, trading idle core time for a 38.0% wall reduction cut VM cost by 38.0%.
Round 3 split the Aho-Corasick automaton at offset 0. Catalog profiling showed that 75% to 98% of templates are anchored at offset 0. Those templates cover 46.7% of scanned bytes (41.7% of glog, 59.1% of yb_controller, and 99.9% to 100.0% of PostgreSQL lines). Splitting the automaton into an anchored probe and a floating fallback gave 0 divergences across 6.44 million real lines and 1.87 million synthetic lines. It cut profile samples by 18% (subset wall 0.483x, CPU 0.905x).
Round 4 (1f10089) isolated a nested Rayon thread-pool contention pattern in cloud verification. To overlap decompression and matching, an OS match thread called rayon::par_iter on the global pool while global-pool file workers waited on recv_timeout. It passed local checks on a 12-core laptop, where only 1 file pipelined at a time. In the cloud (--threads 8), when 8 files >= 16 MiB pipelined at once, all 8 global workers waited in recv_timeout. That starved the par_iter tasks that fed them. Four of five mid-size VMs and one large VM stalled at 0.0% CPU for 40 to 118 minutes. Our verification protocol voided all 7 Round 4 jobs (including one 10.4 GB bundle that finished at 0.828x) and isolated matching onto a dedicated match_pool(). We also added a 30 s tiny-pool saturation unit test and an automated liveness.py watchdog (< 2% CPU for 20 minutes aborts). Stress testing on B10 also exposed an upstream arrow-array 32-bit signed offset limit (> 2 GiB) at 2,003 s. Splitting batches at 1 GiB (837b79b) eliminated it.
Rounds 4b and 5 triggered the 1.10x memory gate. Rewriting body_normalize with a 256-entry byte-class table (candR4f, skipping 95% of bytes) hit 0.889x wall, 0.939x CPU, and 1.039x RSS. Next, we added background spill, an in-memory residual run, and parallel Parquet encoding (candR5w). We also added zero-copy ArgSpan arenas (candR5), which avoided 72% to 95% of transient argument allocations. That pushed wall ratios to 0.703x (small, n=4) and 0.464x (large, n=2).
Then the pre-registered RSS <= 1.10x gate fired. Arm candR5w hit 1.161x RSS, and candR5 hit 1.142x (small) and 1.265x (large). We rejected both and ran a 3-arm Pareto ablation on one binary.
- Arm
r5x(all on) hit 0.709x small and 0.582x large wall time, but RSS hit 1.184x small and 1.284x large (REJECTED). - Arm
r5xnores(residual off) hit 0.717x small and 0.602x large wall time, but RSS hit 1.126x small and 1.263x large (REJECTED). - Arm
r5xnoenc(parallel encode off) cut RSS to 1.006x small (95% CI 0.966 to 1.045) and 1.038x large (ACCEPTED). It kept a 0.820x and 0.764x wall win.
Measured directly against the original baseline (22c6c41) under ABBA, the shipped binary (2141040) passed all gates with 100% c1 equivalence.
- Small and mid tier (
fins, n=7, 0.09 to 4.58 GB). Wall GM hit 0.446x (2.24x faster, range 0.130x to 0.608x; 0.538x withoutB02, whereB02ran 7.69x faster at 0.130x). CPU GM was 0.685x (-31.5% CPU, <= 0.95x gate) and peak RSS GM was 1.092x. - Large tier (
finl, n=2, 9.76 and 10.43 GB). Wall GM hit 0.209x (4.78x GM; 6.80x and 3.36x faster at 0.147x and 0.298x). CPU GM was 0.994x and peak RSS GM was 1.106x.
Allocator and PGO round (ABCCBA, 11 bundles) showed why mimalloc is tier-gated. Two-stage LLVM PGO (trained on 3 disjoint bundles) hit 0.949x wall GM (95% CI 0.937 to 0.963). It hit 0.934x CPU GM and 0.978x RSS GM (worst bundle 1.031x <= 1.10x). Linking mimalloc hit 0.895x wall GM (95% CI 0.866 to 0.924) and 0.920x CPU GM. It cut peak RSS GM to 0.746x (-25.4% memory; 0.627x and 0.495x on the 10 GB bundles). However, mimalloc failed the worst-bundle RSS <= 1.10x gate on three ~110 MB small bundles (1.166x, 1.434x, and 1.437x) due to fixed per-thread segment reservation. We gated mimalloc for >= 30 GB bundles, where it cut B12 peak RSS from 52.9 GiB to 12.8 GiB (4.1x).
The 46% Bloom filter tax hiding in Parquet defaults
To speed up narrow time-window queries in DuckDB, storage arm W3 halved the Parquet row-group cap from 256k to 128k rows (AB-2026-10-02-read-side-w1-w3). Instead of helping, W3 bloated total Parquet output by 1.44x (+44%, from 2,442.5 MB to 3,504.0 MB). It also slowed cold queries by 1.30x to 1.45x (wall 1.040x, RSS 1.020x). Arms W1 (args_text, wall 1.058x, +4% to +19% size) and W2 (byte-capped row groups, +33% to +56% size) also failed.
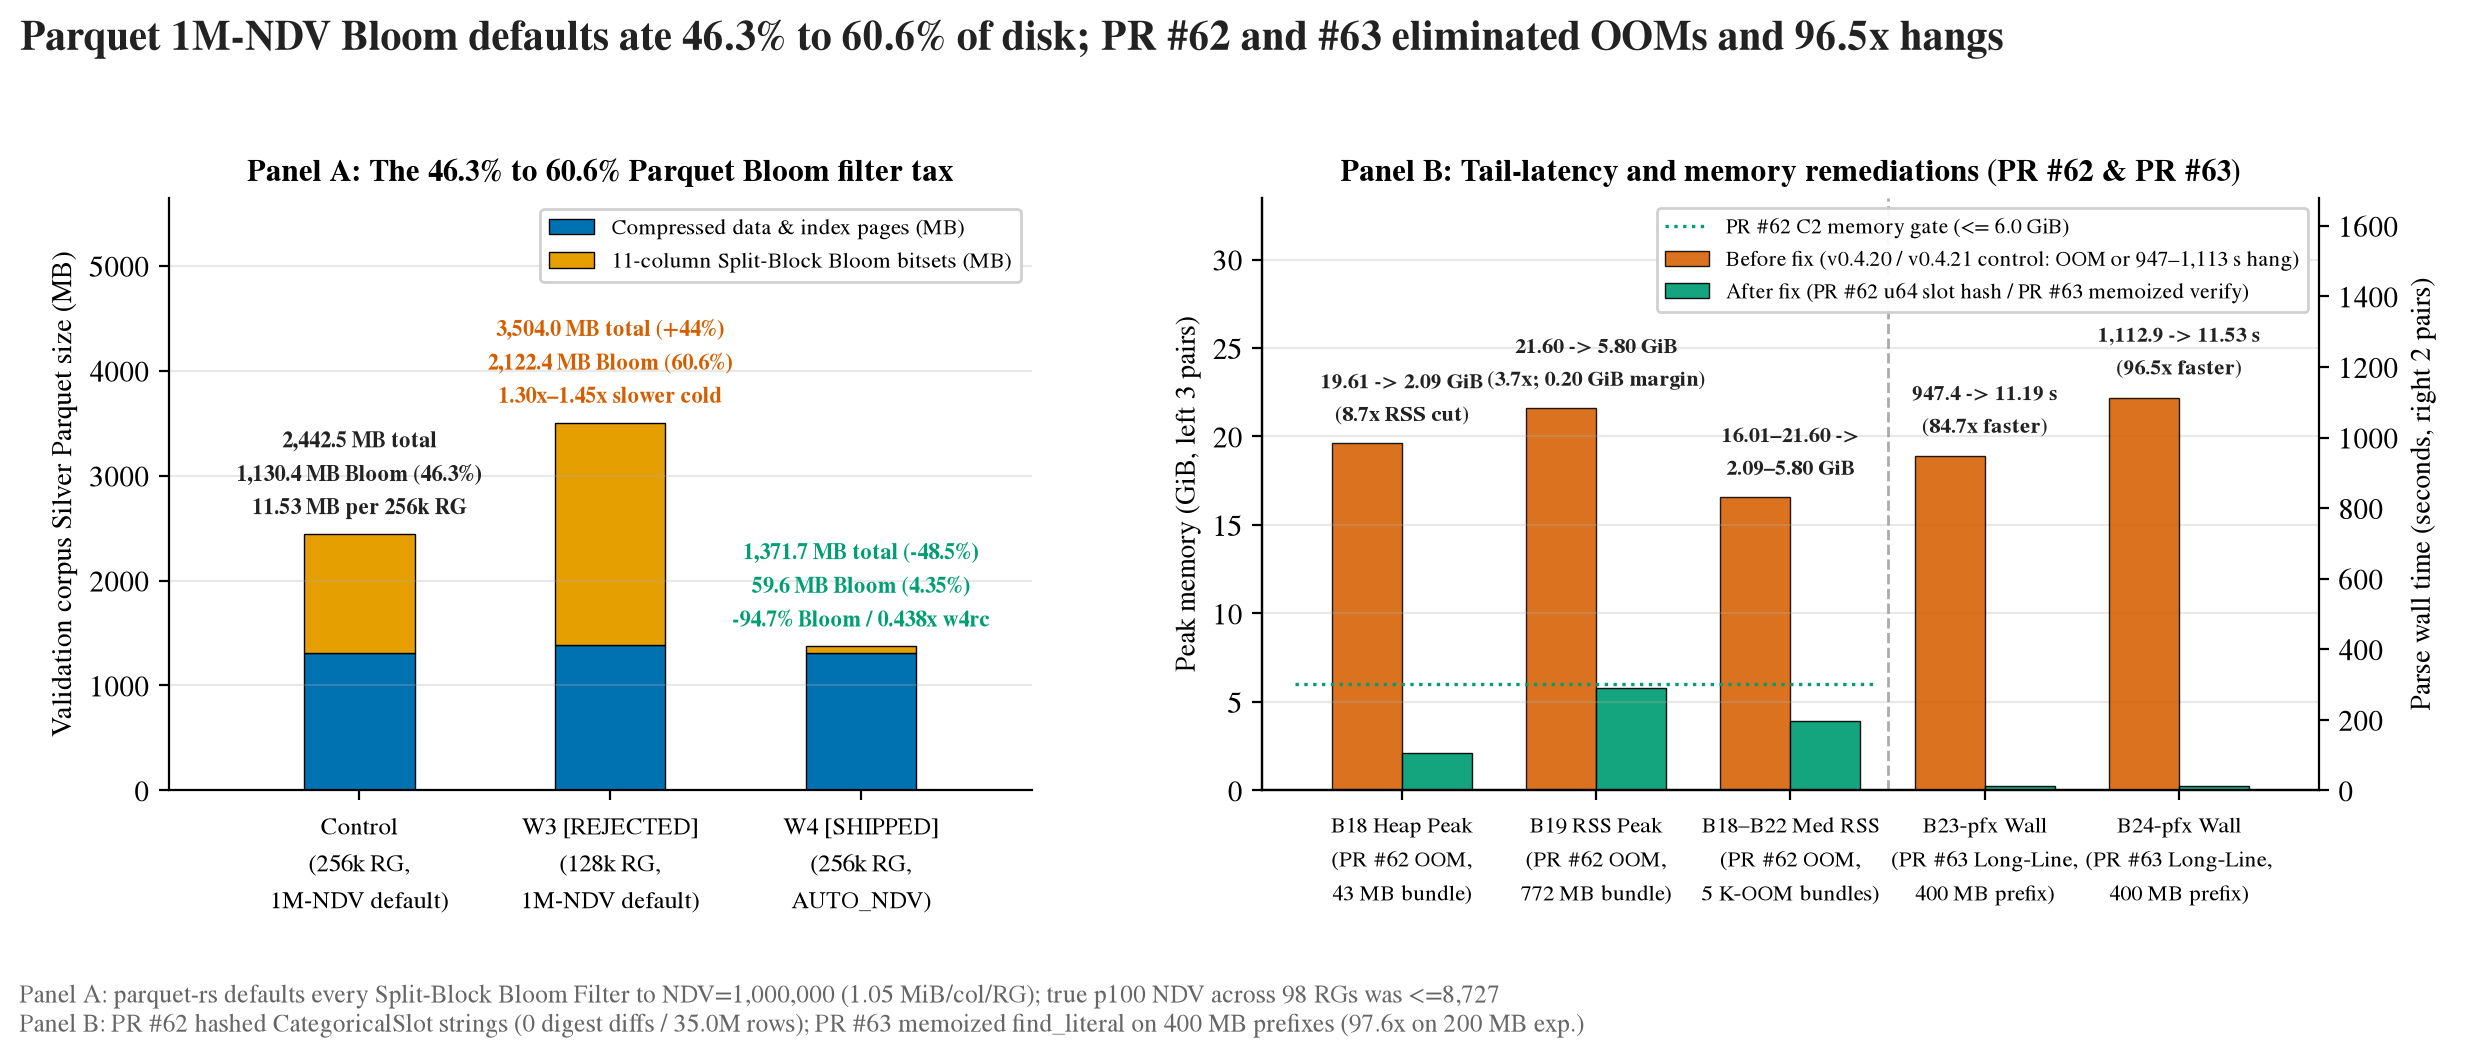
Inspecting Parquet metadata across 98 control row groups (22.3 million rows) exposed the cause. Default parquet-rs settings size every Split-Block Bloom Filter for NDV = 1,000,000 at 5% false-positive probability (6.875 bits/key). Rounded to the next power of two, that equals 1,048,594 bytes, or 1.05 MiB per column per row group. With 11 Bloom columns enabled, every 256k-row group carried 11.53 MB of fixed Bloom bitsets.
- Legacy Control (256k row groups). Bloom bitsets took 1,130.4 MB out of 2,442.5 MB total (46.28% Bloom tax, or 46.3%). On
glogalone, Bloom filters took 59% (127 MB of 216 MB). - Arm
W3(128k row groups, rejected). Doubling row groups doubled the fixed Bloom tax to 2,122.4 MB out of 3,504.0 MB (60.57% of file bytes, or 60.6%). Data pages stayed at 1,381.6 MB (vs 1,312.1 MB in control). - Arm
W4(AUTO_NDV,PR #58, shipped). Across all 98 row groups, the truep100distinct count was 8,727 fortablet_uuid, 3,213 fortemplate_id, and 57 fortransaction_id. The other 8 columns had <= 15 distinct values. Sizing each column to>= 8xits observedp100cut Bloom bytes by 94.7% (from 1,130.4 MB to 59.6 MB, or 4.35% of file bytes). Total Silver Parquet shrank to 0.515x (-48.5%, and 0.438x [-56.2%] on confirmation).
On the 78-shape diagnostic DuckDB benchmark, W4 read 0 row groups on all 17 absent-entity queries and cut present-query bytes by 4x to 20x. Bloom bytes per query fell from 45 to 47 MB down to 0.2 to 5.8 MB. Cold-cache bytes dropped to 0.71x (0.53x to 0.80x by tier; cold wall 0.85x to 0.96x). All Parquet footers stayed <= 357 KiB, fitting one 512 KiB tail GET. A pre-registered rule that no single query shape regress by > 5% at warm p50 tripped on 27 of 78 shapes. However, a control-vs-control A/A run on the same laptop failed 9 of 30 shapes (30%), proving the unpooled 5% rule was narrower than warm-query jitter.
Tail-latency and memory remediations: when average benchmarks miss OOMs and 96x hangs
In October 2026, we ran an 831-job backfill across 741 distinct production bundles. In total, 705 bundles completed by natural key (95.1%, or 97.1% excluding 15 unindexed uploads, up from 88.7% historical), while 21 tail failures surfaced. Four pre-registered campaigns fixed them.
- The 19.61 GB heap / 21.60 GiB RSS OOM on sub-1 GB bundles (
AB-2026-10-06,PR #62). Ten small bundles terminated with out-of-memory errors on 16 GiB VMs. BundleB18(43 MB compressed) hit a 19.61 GB heap peak and 18.13 GiB RSS. Its YBA logs folded 132 million physical lines into 54k logical lines up to 16 MiB each. StructCategoricalSlotkept up to 256 full multi-MB strings indistinct_set, whileRow::size_estimatecharged a flat 2,048 B, blinding the 1.5 GiB spill budget. Because Parquet writers only readdistinct_set.len()and cap samples at 256 chars, we hasheddistinct_settou64, capped samples at 1 KiB, and charged exact bytes. Across 5K-OOMbundles (B18toB22: 43, 772, 264, 398, and 75 MB), peak RSS fell by 3.2x to 8.7x. Memory dropped from 16.01 to 21.60 GiB down to 2.09 to 5.80 GiB (median RSS ratio 0.246x, wall 0.962x). All 25(bundle, log_type)pairs (35.0 million rows) matched 100% onc1. Caveat. BundleB19peaked at 5.80 GiB, leaving only 0.20 GiB (3.4%) headroom below the 6.0 GiB gate underglibcmalloc. That was 1.9x higher than exploratorymimallocruns (4.6 GiB onB19and 2.8 GB onB22). Also, bothK-REGcontrol bundles (B08andB09) containedyba_platformrows (28.1k and 83.5k). Their peak RSS fell too, from 8.33 to 2.90 GiB (0.348x) and from 6.27 to 5.06 GiB (0.807x). - The $O(H \times T \times L)$ long-line hang (
AB-2026-10-11,PR #63). BundleB23(3.35 GB plain, 10.3k lines up to 951 KiB) hit the 3,600 s file timeout. BundleB24(8.34 GB plain, 16.3k lines up to 1.98 MiB) timed out too. Functionradix::verifytook 81% to 87% of CPU. For each of the $H$ Aho-Corasick hits in the first 64 KiB and $T$ candidate templates, it scanned the full 2 MiB line ($L$). It copied 64 KiB intoArgByteson every failed probe and re-tested Pass-1 hits in Pass-2, whileYBA_STD_REonmaintook 74% of remaining CPU. Memoizingfind_literalper line, deferringArgBytesslicing, restricting Pass-2 to the 4,096 B boundary overlap, and stripping the regex tail fixed it. Confirmatory 400 MB prefixes ran 84.7x faster onB23-pfx(947.44 s to 11.19 s) and 96.5x faster onB24-pfx(1,112.90 s to 11.53 s). On the exploratory 200 MB prefix ofB24, runtime fell 97.6x (575.1 s to 5.89 s). Masterglog(B25-glog) ran 3.60x faster (225.67 s to 62.77 s). FullK-OOMbundles ran 1.92x to 4.67x faster (wall ratio 0.214x to 0.521x, median 0.454x, RSS 0.995x). Per-line deadline checks cut watchdog overshoot from 27 to 29 s down to 0.5 to 0.6 s. That overshoot was measured in exploratoryfix1(91.5 s on a 91 s budget and 191.6 s on a 191 s budget). In confirmatoryC4, Arm B finished the 91.6 MiB synthetic file in 2.6 s under its 91 s (20 s/MiB) allowance. Arm A hung past 900 s (an 809 s overshoot). - Terabyte-scale range merge (
AB-2026-10-02/04/05,PR #61). Above 30 GB,glogspills hundreds of 256k-row runs ($R \gg 64$). Close time jumped +29% at $R=66$ (21.6 s to 27.8 s) with a 5.5x slope (16.5, 37.8, and 91.4 s). Meanwhile, 1.2-rowRecordBatch::slicecalls burned 60% of merge CPU (9.2 to 9.5 us/row, 35.1 billion slices onB14). We combined parallel 64-run fan-in reduction,arrow::compute::interleave(9.2 to 3.4 us/row, -63%), and 8/16-way timestamp-quantile range merge. That sped up 10.4 GBB11to 0.60x (757 s to 458 s; close 0.22x, or 4.5x faster). It also finished 21.8 GBB13(278.5M rows, timed out at > 9,103 s) in 1,652.5 s (27.5 min). On 33.6 GBB12, runtime fell 8.06x from 10,953 s (7,363 s merge) to 1,359 s (22.6 min, wall ratio 0.124x). Withoutmimalloc,B12took 2,472 s (558 s merge, 13.2x faster) and 2,047 s one2-highmem-16. LinkingmimalloccutB12peak RSS from 52.9 to 12.8 GiB (0.242x, 4.1x cut). Scale-limitB14spans 85.08 GB compressed, 1.415 TB unpacked, and 2.439B lines across 82 nodes and 169 chains. Baseline timed out at 43,200 s (12 h) after 3.5 h parse and > 7.5 h merge. Undera85(16 vCPU, 8 ranges),B14finished in 8,840 s (147.3 min, 2.46 h) at 13.4 GiB RSS. Undera86(22 vCPU, 16 ranges, 12,288 MB parse cap),B14finished in 3,692.9 s (61.5 min) at 33.2 GiB RSS. Parse took 2,700 s, reduce took 416 s, and range merge took 575 s. It wrote 56.7 GB across 117 files with 532,768,029 bit-exact bursts across the 3 range-merged planes (532,812,960 total, 99.977% match rate). - Year-floor and
vlog<n>:fallback (AB-2026-10-12rejected,12b/PR #65shipped). Yearlessglogheaders dated 212 of 4,136 rotated files (> 365 days old) one year into the future. That shifted 1,804,045 rows onB29a, 1,536,406 onB29b, 1,438,694 onB29c, 12,275 onB30, and 107 on a fifth bundle. Meanwhile,vlog<n>:prefixes made 81,463,043 of 188,430,112 lines (43.2%) unknown onB25. ArmAB-2026-10-12(7cfac29) strippedvlog<n>:unconditionally and failedC3. It added +1,872 unknowns onB09(87,705 to 89,577) and +5 onB29b(330,367 to 330,372; +1,877 total). Median wall was 0.996x and RSS was 1.010x, because<*>:-prefixed templates needed thevlog1token. Adding a whole-body fallback inAB-2026-10-12b(b01d68e) cut future-dated rows to 0 across all 14 bundles. It also cutB25unknowns from 81,463,043 to 98,305 (43.2% to 0.05%, or 56.8% to 99.95% matched). That recovered 81.36 million lines (99.9%) with 0 new unknowns elsewhere (wall 1.004x, RSS 0.999x).
How pre-registered invariant gates caught three subtle template-catalog interactions
Every glog line carries its emitting filename (such as raft_consensus.cc), and every catalog row records the source file it was mined from. We ran three pre-registered experiments (AB-2026-10-13, 13b, 13c) to test per-file indexing and test-template pruning. Our invariant gates rejected all three candidates before merge, uncovering three non-obvious properties of source-mined log catalogs.
- Experiment
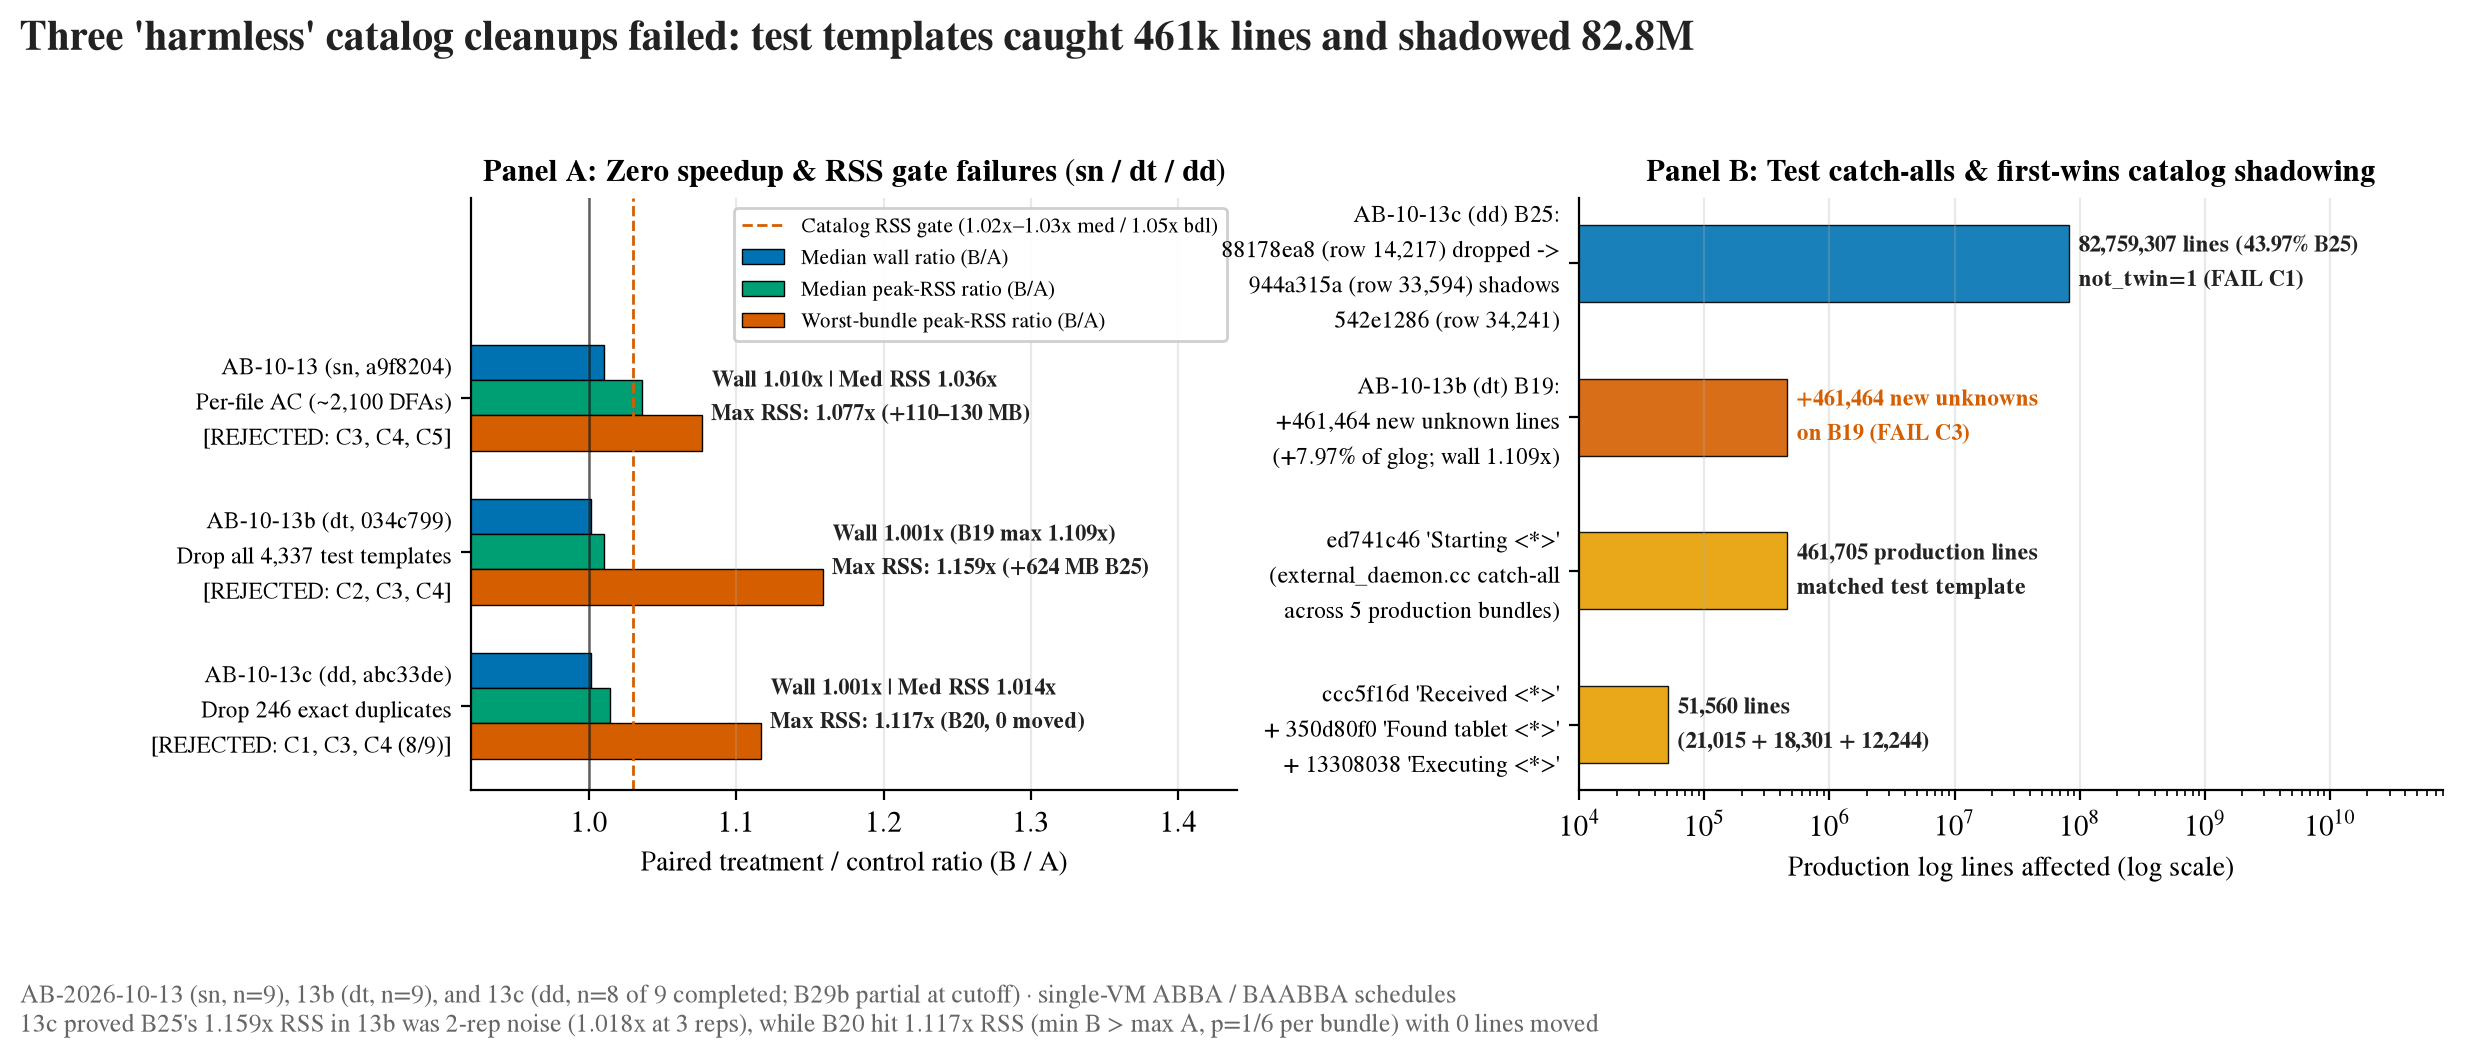
AB-2026-10-13(sn, commita9f8204, per-source-file Aho-Corasick tables). Building ~2,100 per-(format, basename)AC tables across 1,058 basenames exposed that 32% ofglogtemplates (3,778 of 11,978) come from test files. It also showed that88178ea8(Read time: <*>inasync_writes-test.cc) was capturing 82,759,307 production lines onB25emitted bytserver/read_query.cc(542e1286). YetsnfailedC3,C4, andC5across 9 bundles. Defaultaho-corasicksettings built full DFAs for small tables, adding +110 to 130 MB fixed RSS. Median RSS hit 1.036x (> 1.03x gate, max 1.077x) and median wall hit 1.010x (max 1.062x). Shared C++ helpers (long_operation_tracker.cc,async_rpc_tasks_base.cc) failed the 10% specificity guard at 90.4% and 91.6%. AndC3revealed that multiline continuations callradixmore than once per logical line (195.8M calls vs 188.3M lines onB25; 249.8M vs 165.9M onB09). - Experiment
AB-2026-10-13b(dt, commit034c799, dropping all 4,337 test-file templates). Removing all 4,337 test templates inglog(36.2%) andyb_controller(36.3% of 11,951) across 412 test files needed zero extra DFA memory. However,dtfailedC2,C3, andC4. OnB19, unknown lines jumped by +461,464 (+7.97% ofglog) and wall time regressed to 1.109x. Across the 9 bundles, median wall was 1.001x, median RSS was 1.010x, and max RSS hit 1.159x (+624 MB) onB25. Three other bundles also failedC3(+18,191 [0.067%], +2,923 [0.154%], and +265 [0.0102%], plus +9,545 and +8,858 on two others), andC2tripped onwtl_mapping_sha. Only 14 of the 4,337 dropped templates matched any line. They were led byed741c46Starting <*>inexternal_daemon.cc(461,705 lines),ccc5f16dReceived <*>(21,015),350d80f0Found tablet <*>(18,301), and13308038Executing <*>(12,244). Generic test templates were acting as accidental production catch-alls. - Experiment
AB-2026-10-13c(dd, commitabc33de, dropping 246 exact-duplicate test templates). Of 265 same-text test templates, we kept 19 that differed inHasContextPrefix. We dropped only the 246 exact effective-template duplicates (2.1%), guaranteeingΔU = 0. Across the 8 of 9 completed bundles in our isolated benchmark environment (B29bpartial at cutoff),ΔU = 0held everywhere, yetddfailedC1,C3, andC4.- Criterion
C1(not_twin = 1onB25). We dropped88178ea8(row 14,217) and2d46d039(row 25,106). All 82,759,307 lines (43.97% of matchedglog) were then captured by944a315a(pg_client_session.cc, row 33,594,HasContextPrefix=true, effective<*>Read time: <*>) with an empty leading<*>. They never reached their true production twin542e1286(read_query.cc, row 34,241,Read time: <*>). - Criterion
C3(per-bundle RSS gate onB20). Median RSS across the 8 bundles was 1.014x (<= 1.02x pass). OnB25, 3-rep RSS fell to 1.018x (A = [4,130, 4,592, 4,346] MB,B = [4,100, 4,578, 4,619] MB), proving13b's 1.159x was 2-rep noise. YetB20hit 1.117x RSS (> 1.05x limit, withmin(B) = 3,451 MB > max(A) = 3,419 MBacrossA = [3,335, 3,419] MBandB = [4,094, 3,451] MB) despite 0 lines moving and byte-identical output. - Criterion
C4(wall time). Median wall ratio was 1.0005x (1.001x rounded, > 1.00x limit; max 1.031x). Aho-Corasick scan time is $O(\text{input bytes})$, so pruning catalog rows yields zero speedup.
- Criterion
Verification gates and methodology checks
- The A/A test against our own equivalence gate. Running the unmodified baseline binary against itself rejected per-file
sha256sumchecks (C1b). It exposed the 69-row rollover shift onB04and set a ±5% to 7% single-bundle noise floor. - Leave-one-out sensitivity on Round 1. Dropping the single YBA-heavy bundle
B02(0.385x wall) movedcandCwall GM from 0.887x to 0.985x (CPU 1.004x). It also movedcandBto 0.980x (CPU 0.984x). We recorded Round 1 as a failed general gate and a YBA tail fix. - Enforcing the 1.10x RSS gate on our fastest Round 5 arm. Arm
candR5hit 0.703x small and 0.464x large wall time. We rejected it as default because RSS hit 1.142x and 1.265x, and ran the 3-arm ablation that selectedr5xnoenc(1.006x and 1.038x RSS). - Combinatorial false-positive math on
AB-2026-10-13c(C3). Why didB20tripmin(B) > max(A)with 2 reps/arm when 0 lines moved? Under exchangeable noise, $\Pr(\min(B_1, B_2) > \max(A_1, A_2)) = 1/\binom{4}{2} = 16.7%$ per bundle. Across 8 bundles, the family-wise false-positive rate is $1 - (5/6)^8 = 76.7%$. - A/A control on the 78-shape query benchmark (
W4). When 27 of 78 shapes exceeded +5% warmp50latency, running control against control failed 9 of 30 shapes (30%). That proved the unpooled 5% rule was testing OS and laptop jitter. - Downstream SQL and LLM token invariance. Across all shipped performance arms,
c1matched 100% (total variation distance 0.0). That preserved the 125,000:1 to 286.6:1 DuckDBGROUP BYcollapse in 25 to 52 ms (26.4 ms CPU). It also preserved the 25.9x MCP summary speedup (3,053 ms to 118 ms). Prompt tokens across 25 golden queries still dropped 74.2x to 88.4x (3.56M to 47.9K tokens; up to 23,419x on conflict storms).
Hypotheses and candidate patches rejected by the gates
- Four LLM static-audit hypotheses. Lock contention on
Mutex<ShardWriter>(< 0.4% wait),_unknownskey bloat (0.0%),run_pipelined8,192-line batch memory (backwards), and gzip decode as bottleneck (3.5%) all failed. - Unpaired cross-VM cloud timings. Rejected by +43.7% to 2.19x identical-binary drift across GCP
e2VMs. - Per-file SHA-256 and per-file row digests (
C1b). Rejected by parallel tie-order permutations and the 69-row byte-size rollover shift. - The 64 KiB
body_normalizetruncation cap (N03) andR01arrow_castbypass. The 64 KiB cap was neutral on ~300 B lines (12.2% to 15.8%), andR01(< 1.8% CPU) broke Parquet schema compatibility. - Round 4 shared-pool reader/matcher overlap (
1f10089). Rejected after nested Rayonpar_itertasks deadlocked 4 of 5 mid-size VMs at 0.0% CPU for > 40 minutes. - Default-on parallel Parquet encoding (
candR5w,candR5,r5x,r5xnores). Rejected by the pre-registeredRSS <= 1.10xgate (1.126x to 1.284x RSS). - Unconditional
mimallocon small VMs. Rejected on < 1 GB bundles by 1.166x to 1.437x RSS growth on ~110 MB processes (gated for >= 30 GB bundles). - Storage arms
W1,W2, andW3(128k row groups). Rejected afterW3doubled 1,000,000-NDV Bloom filters to 60.6% of file bytes (+44% size, 1.30x to 1.45x slower cold queries). - Unconditional
vlog<n>:stripping (AB-2026-10-12) and all three catalog-pruning arms (AB-2026-10-13,13b,13c). Arm12added +1,877 new unknowns, while13added +110 to 130 MB of DFA overhead. Arm13badded +461,464 unknowns from losing test catch-alls, and13cfailed on<*>Read time: <*>shadowing plusB201.117x RSS.
Pressure tests
Every finding was attacked across the six standing fronts in Methods.
| Front | Attack applied to this study | Status | Result |
|---|---|---|---|
| 1. Specification | Does a constant proportional ratio ($B/A$) hold across bundle sizes, or are there step changes? | Run | Replaced linear model with step model: shard close has a +29% step at $R=66$ runs (21.6 s to 27.8 s), a 5.5x superlinear slope (16.5 to 91.4 s), and an $O(H \times T \times L)$ regime on lines > 64 KiB. |
| 2. Aggregation | Is the Round 1 whole-corpus geometric mean (0.887x wall) a broad speedup or one outlier bundle? | Run | Rejected pooled Round 1 claim: leave-one-out without B02 (0.385x) moves candC wall GM from 0.887x to 0.985x (CPU 1.004x). Both with- and without-B02 GMs are reported. |
| 3. Adjustment coarseness | Do 4 compressed-size VM tiers hide extreme decompression-ratio skew (5x to 41x)? | Run | Confirmed and patched: YBA .gz logs expand 35x to 41x vs 5x on binary archives. Estimating .gz at 8x for the 16 MiB pipeline cutoff (candP) and scaling timeouts by 20 s/MiB (PR #63) fixed coarse-bin failures. |
| 4. Prior work | Are cloud VM variance, Bloom filter sizing, or AST log templates novel? | Run | Cited and separated: cloud variance cites Mytkowicz et al. (2009) and Laaber et al. (2019); templates cite Drain (2017) and LogGrep (2023); mimalloc cites Leijen et al. (2019). Our contribution is the pre-registered differential protocol and the parquet-rs 1M-NDV Bloom diagnosis. |
| 5. Baseline sufficiency (Matched null) | What does an A/A control run predict for within-VM ratios, 2-rep min > max gates, and 78-shape p50 guards? |
Run | Rejected two naive gates: A/A (n=4, GM 1.007x) proved < 6% shifts are noise; combinatorial null $1/\binom{4}{2} = 16.7%$ explained B20's 2-rep RSS fail in 13c (76.7% across 8 bundles); reader A/A (9 of 30 shapes > 1.05x) rejected W4's unpooled 5% p50 rule. |
| 6. Cross-sectional associations across few units | Do cross-tier comparisons (fins on Spot vs finl on Standard) or AB-10-06 exploratory vs confirmatory RSS confound variables? |
Run | Disclosed as confounded: Spot preempted 9 of 39 jobs (23.1%, exit 50,001 at 24 to 52 min vs 6 to 17 min on small jobs), so > 1 GB tiers used Standard VMs; AB-10-06 exploratory vs confirmatory differed in base commit, mimalloc vs glibc, and VM RAM. |
What this does not show
All measurements come from one Rust workspace (what_the_log) parsing distributed database support bundles across 8 log formats and 17 subsystems. The catalog holds 51,954 canonical templates (49,125 [94.6%] admitted and 2,829 [5.4%] catch-alls; 50,971 [98.11%] AST-mined and 983 [1.89%] corpus-mined). Of those, 36,840 (70.91%) are parameterized with 1 to 27 <*> slots (> 96% of volume) and 15,114 (29.09%) are static. Temporal RLE gives 20x to 30x row reduction across 1.33 TiB of Silver tables and 3,079 registered historical bundles. The methodological rules transfer to any columnar pipeline, while exact multipliers depend on catalog and line-length distributions.
Sample sizes per round were bounded by our $150 cloud budget ($68 spent). Each round used 4 to 14 bundles with 2 to 3 repetitions per arm. Bootstrap 95% intervals over 11 or fewer bundles have below-nominal coverage. We therefore report exact per-bundle ranges and leave-one-out summaries alongside every geometric mean.
We used a two-stage sequential verification protocol across all campaigns. Stage 1 exploratory profiling calibrated candidate bounds, and Stage 2 executed Git-locked confirmatory runs (P01 to P09, AB-10-12, AB-10-13 to 13c). Headline gates (0c62ad4: wall <= 0.85x, CPU <= 0.95x, RSS <= 1.10x) and AB-10-06/AB-10-11 magnitude bounds were locked between Stage 1 and Stage 2. In AB-2026-10-06, each arm ran once per bundle (n=1) and both K-REG bundles contained yba_platform rows, leaving a zero-YBA negative control untested. In AB-2026-10-13c, 8 of 9 bundles completed before the session cutoff. On 85.08 GB (85.1 GB) Bundle B14, the baseline binary timed out at 12 hours. Equivalence on B14 is therefore tested between a85 (16 vCPUs) and a86 (22 vCPUs) across 532,768,029 bursts, backed by baseline-vs-treatment equivalence on 10.4 GB B11 and 33.6 GB B12.
Reproduce
We are preparing our Rust log-to-Parquet workspace and its 1,368-line zero-axiom Lean 4 specification for open-source release under the Apache 2.0 license. The release bundle includes all docs/AB-*.md pre-registration records, synthetic log generators (synth.py), and the Cloud Batch benchmark harness (bench/gcp_lab/).
Customer support bundles are private. Every number in this report and its four figures is stored in numbers.json, generated by gen_numbers.py and verified by check_release.py.
python3 gen_numbers.py
python3 gen_figures.py
python3 ../check_release.py .
References
- Abedi, A., & Brecht, T. (2017). Conducting Repeatable Experiments in Highly Variable Cloud Computing Environments. Proceedings of ACM/SPEC ICPE 2017. DOI.
- He, P., Zhu, J., Zheng, Z., & Lyu, M. R. (2017). Drain: An Online Log Parsing Approach with Fixed Depth Tree. Proceedings of IEEE ICWS 2017. DOI.
- Laaber, C., Scheuner, J., & Leitner, P. (2019). Software Microbenchmarking in the Cloud. How Bad is it Really? Empirical Software Engineering. DOI.
- Leijen, D., Zorn, B., & de Moura, L. (2019). Mimalloc: Free List Sharding in Action. Proceedings of APLAS 2019. DOI.
- Mytkowicz, T., Diwan, A., Hauswirth, M., & Sweeney, P. F. (2009). Producing Wrong Data Without Doing Anything Obviously Wrong! Proceedings of ACM ASPLOS 2009. DOI.
- Putze, F., Sanders, P., & Singler, J. (2009). Cache-, Hash-, and Space-Efficient Bloom Filters. ACM Journal of Experimental Algorithmics. DOI.
- Wei, J., Zhang, G., Chen, J., Wang, Y., Zheng, W., Sun, T., Wu, J., & Jiang, J. (2023). LogGrep: Fast and Cheap Cloud Log Storage. Proceedings of EuroSys 2023. DOI.