Four frontier models on the same support queue: what separates them, and what does not
- Published
- Data
- 89 closed tickets, 4 arms, Argon round; escalated set pre-registered
- Figures
- 7
The claim
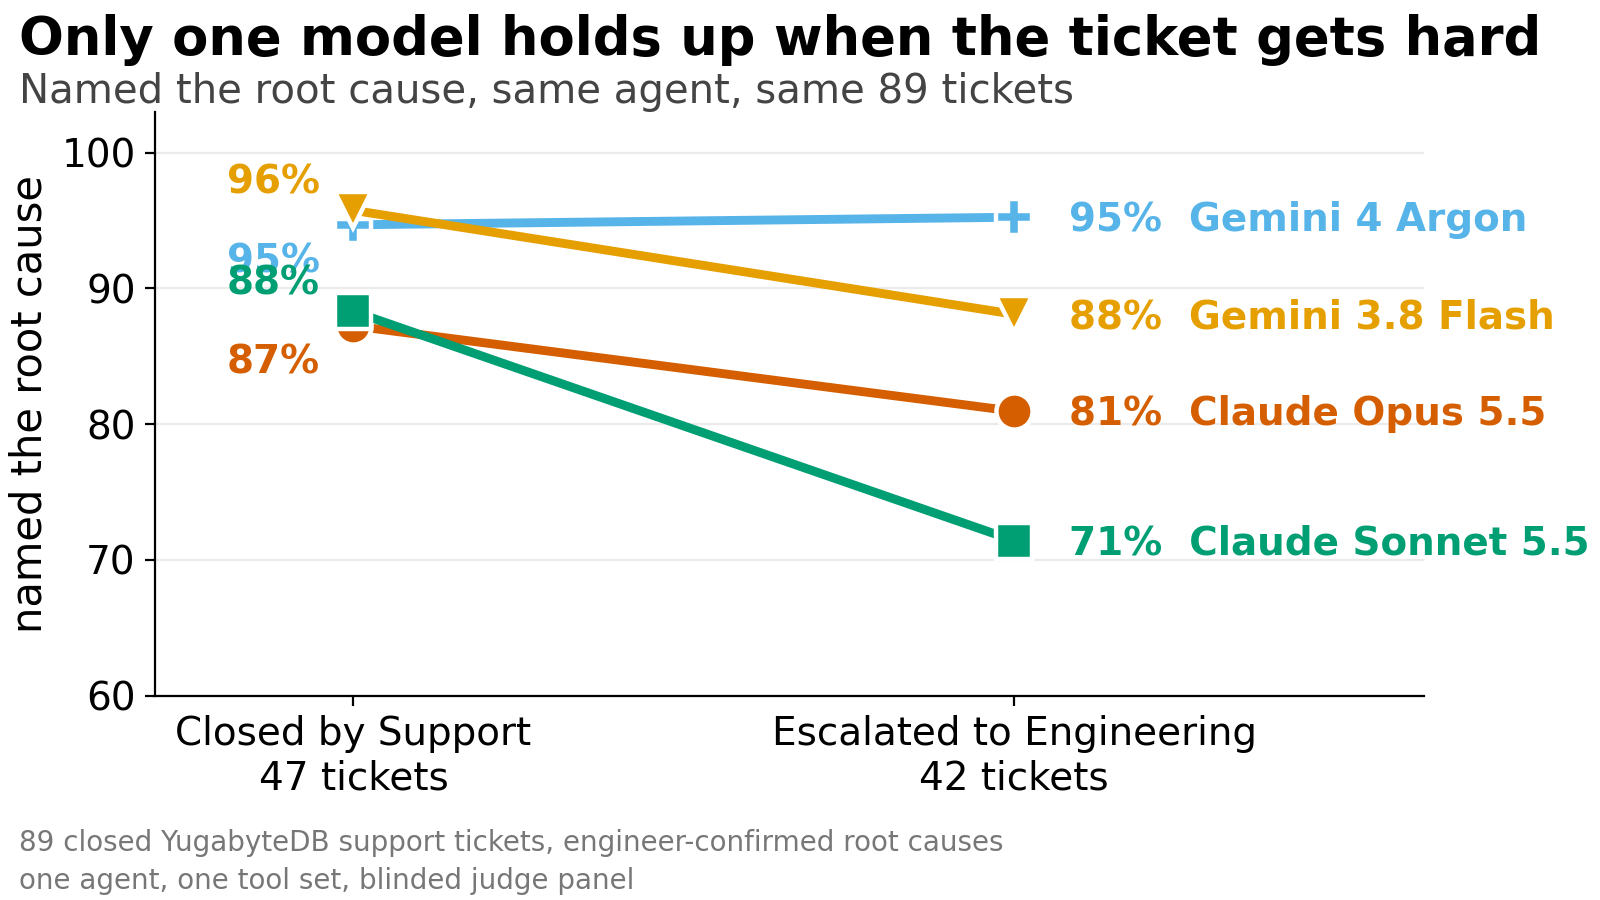
A year of these rounds has taught me that most model comparisons are run on the work a system already does well. Ours was too. On the tickets our Support team closed without help, four frontier models are interchangeable: they name the root cause between 87% and 96% of the time and you could pick on price alone.
Split the same evaluation set by what actually happened to the ticket, and that stops being true. On tickets that had to be escalated to Engineering, three of the four models lose six to seventeen points of accuracy and one does not move.
That is the split a service owner should care about. Escalated tickets consume the scarcest capacity we have, they carry the long tail of time to resolution, and they are the ones a customer remembers. They are also the smaller half of the queue, so a pooled average buries them under the routine work and reports the models as equivalent.
Two other results came out of the same run, and both are more useful than the ranking. Four times the cost buys a more complete evidence chain while the rate of usable answers stays flat, so the premium is worth arguing about on different grounds than accuracy. And across eight models from two vendors and two years of releases, a model's own confidence still carries no usable signal about whether it is right. That has held steady while the models themselves improved, which is the single finding I would most want another team to check before they build on it.
The operational questions
Our agent reads a customer's diagnostic bundle through a set of tools and writes a root-cause assessment before the engineer starts. Four things about that assessment decide whether it earns its place in the queue, and they are the same four as last time:
- Is it usable? An exact root cause, or a partial one pointing the right way, cuts time to resolution.
- Is it wrong? A wrong cause sends the engineer down the wrong path and raises time to resolution instead of lowering it.
- Can we tell which is which before the engineer acts? If the model's own confidence predicted correctness we could gate on it.
- What does it cost, in money and in minutes?
What is new this round is a fifth question, and it turned out to matter more than the first: how much of the evidence behind the answer does the agent actually rebuild?
Why the evidence chain is the product
"It's a disk problem" and "it's a disk problem, here is the saturation figure, here is the log window, here is the configuration that caused it" both score as a correct root cause. Only the second lets an engineer act. The first makes them redo the work to find out whether to believe it.
A pass rate scores both answers the same, so we score the chain separately: of the findings an engineer confirmed were needed to support the root cause, how many did the answer actually produce. We call it evidence recovery.
This is also where adoption lives. Engineers extend trust to a tool that shows its working and withdraw it from one that asserts. A bare verdict gets checked from scratch, which adds handling time to the ticket and quietly teaches the team to skip the draft. On this round evidence recovery is the measure that separates the models, while the pass rate puts them within a few points of each other.
How we measured it
Tickets. 89 closed support tickets with engineer-confirmed root causes. This is a test harness, not live traffic, and it is the same standing set we use for every change to the stack. 47 were closed by Support. 42 were escalated to Engineering.
Arms. Gemini 4 Argon, Gemini 3.8 Flash, Claude Opus 5.5, Claude Sonnet 5.5, through one agent with one tool set. The model is the only variable.
Runs. Every model ran twice on each Support-closed ticket and once on each escalated ticket: 544 judged runs.
Scoring. A blinded panel of two judge models, three passes each, labels every answer and extracts which required findings it produced. Scoring rules were fixed before the runs.
Pre-registration. The escalated set was held back. Before a single run on it, we wrote down the effect we expected, the interval that would confirm it and the result that would tell us the original finding was an artifact of having chosen the measure after seeing the data. The two Claude arms were added afterwards under their own pre-registration, frozen the same way, because publishing a four-model ranking in which two models had only ever been measured on the easy half would not have been a fair comparison.
One thing this cannot separate. Prompts were built against Gemini 3.8 Flash, our production default, and were not re-tuned per vendor. A model that underperforms here is evidence about this harness, not about that model's ceiling.
What comes back
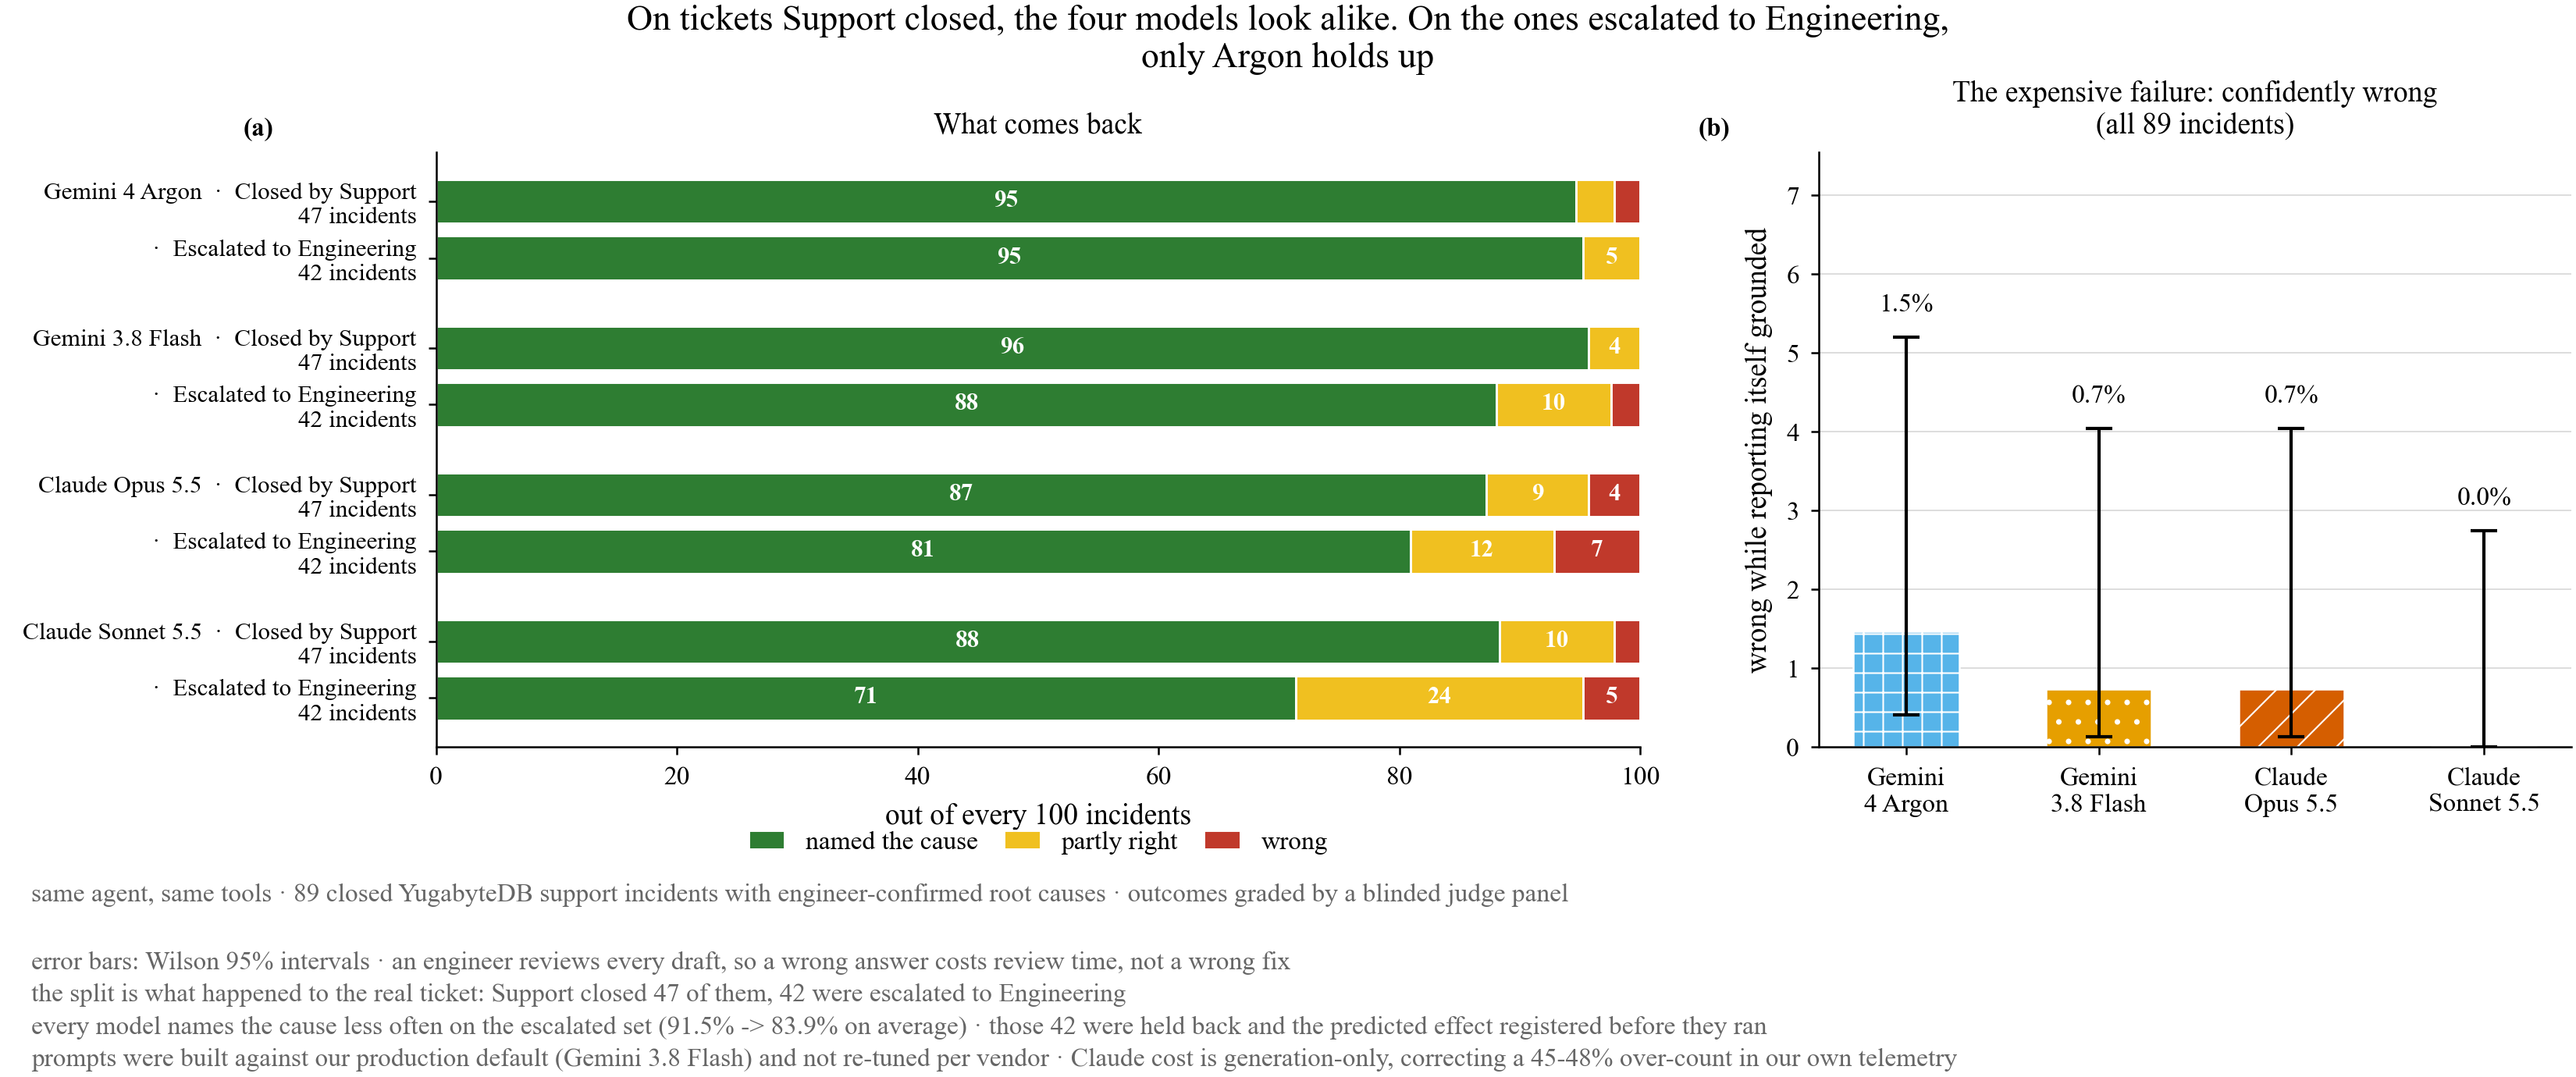
On Support-closed tickets the four arms are within nine points of each other on naming the cause, and two of them are within one. On escalated tickets the spread is twenty-four points. Same agent, same tools, same judges; only the difficulty of the ticket changed.
The rate worth watching sits in the tail: how often an answer is wrong while the model reports itself grounded. Pooled over all 89 tickets that runs from 0.0% to 1.5% depending on the arm. Every draft is read by an engineer, so a wrong answer costs review time rather than a wrong fix; it is still the expensive failure, because it is the one that consumes attention we were trying to save.
The evidence chain, and the result we registered in advance
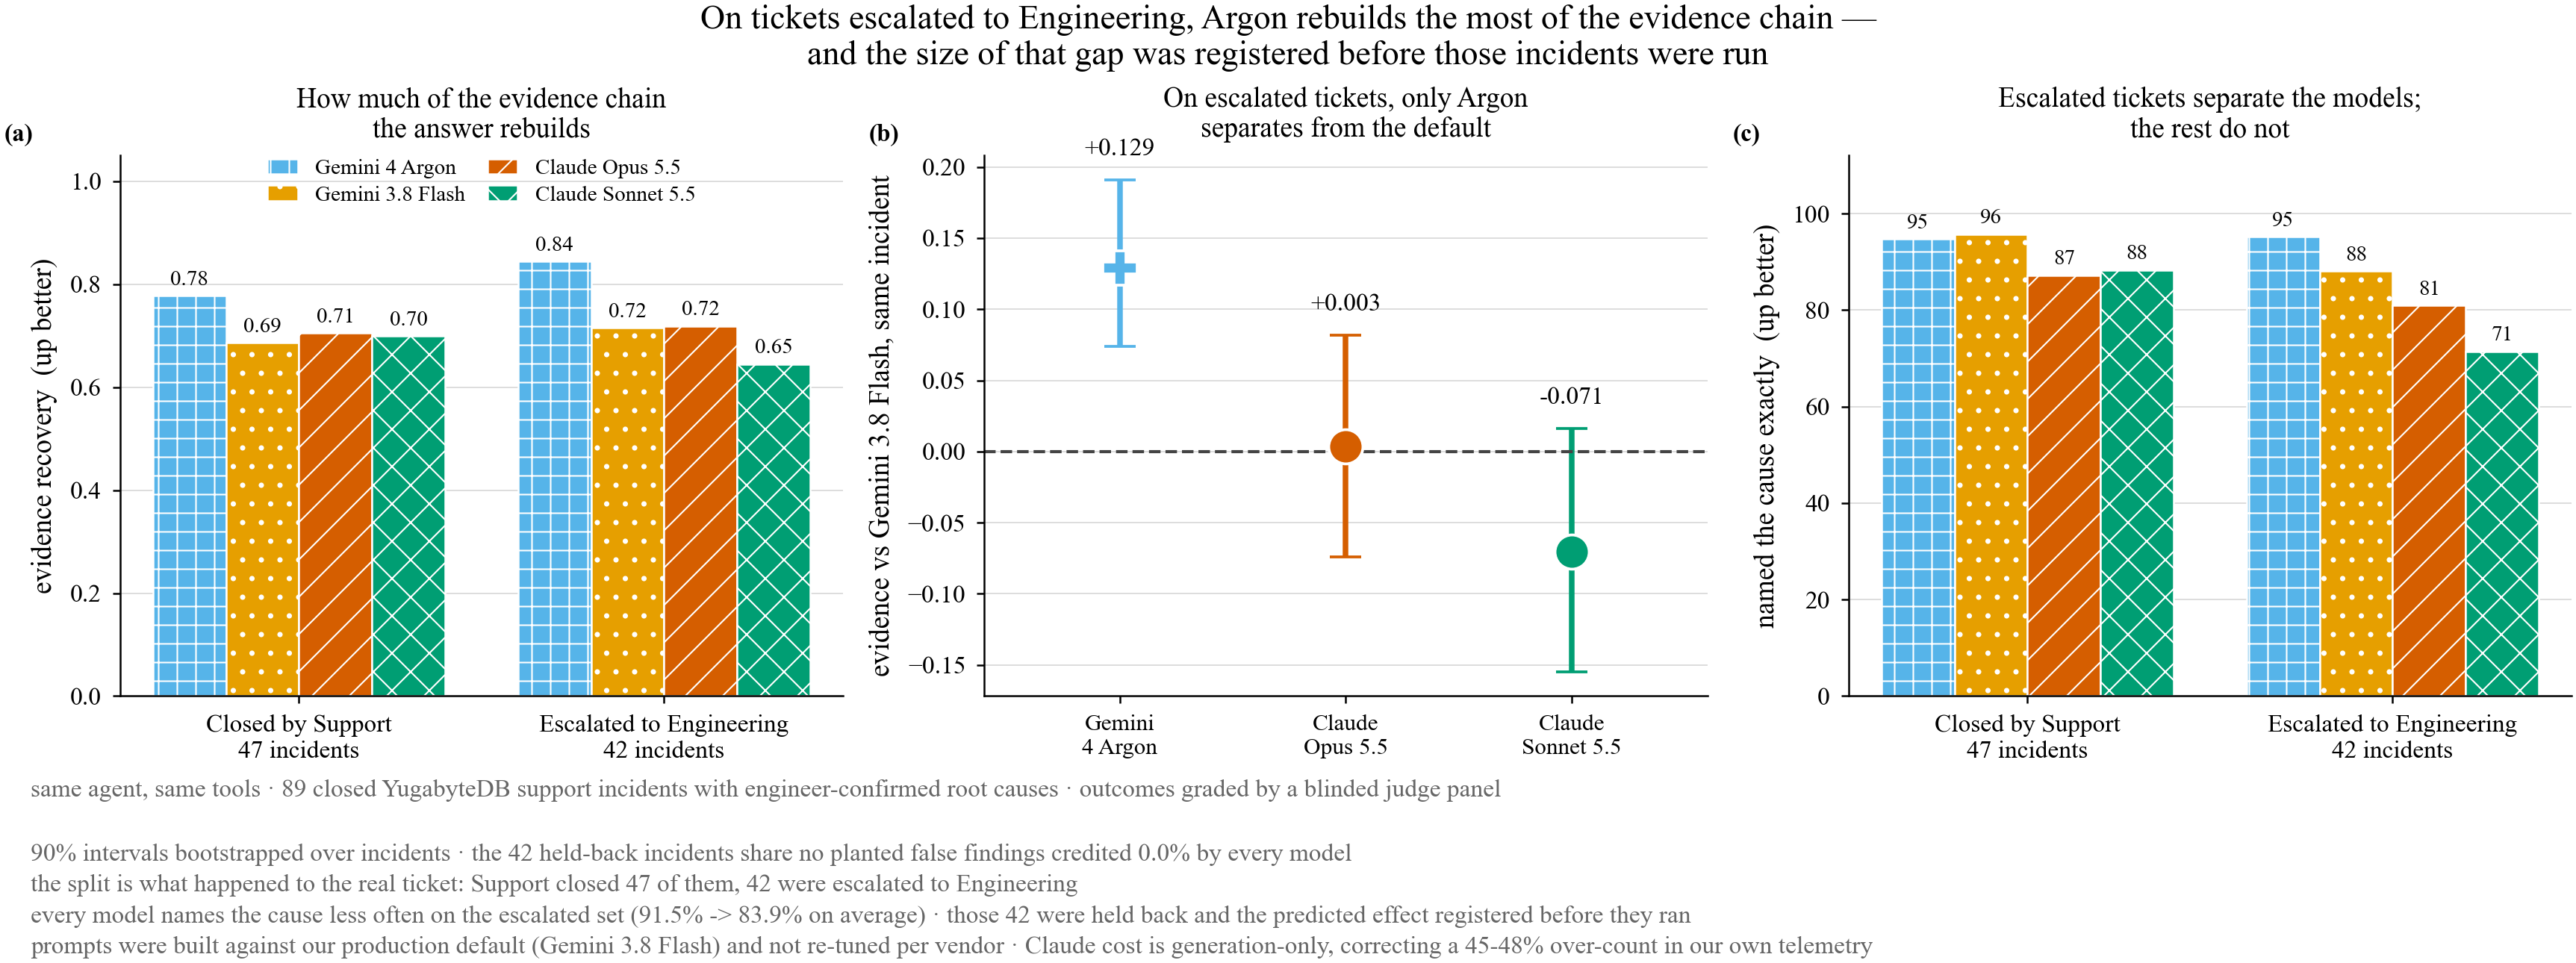
On escalated tickets, evidence recovery is 0.844 for Argon, 0.719 for Opus 5.5, 0.716 for 3.8 Flash and 0.645 for Sonnet 5.5. Argon against our production default is +0.129, with a 90% interval of +0.074 to +0.191. That effect was predicted in writing, with its direction and an interval that would have falsified it, before those 42 tickets were run. Neither Claude arm separates from 3.8 Flash on this measure.
Two controls, because the obvious objection is that a model which writes more will be credited with more. Within every arm, longer answers do not score higher recall. And we planted two plausible-but-false findings per ticket, drawn from the vocabulary of other tickets: every model credited 0.0% of them.
Both judges on the panel produce the same ordering, including the judge from the same vendor as two of the arms, which marked its own family down rather than up.
Can you trust what the model says about itself
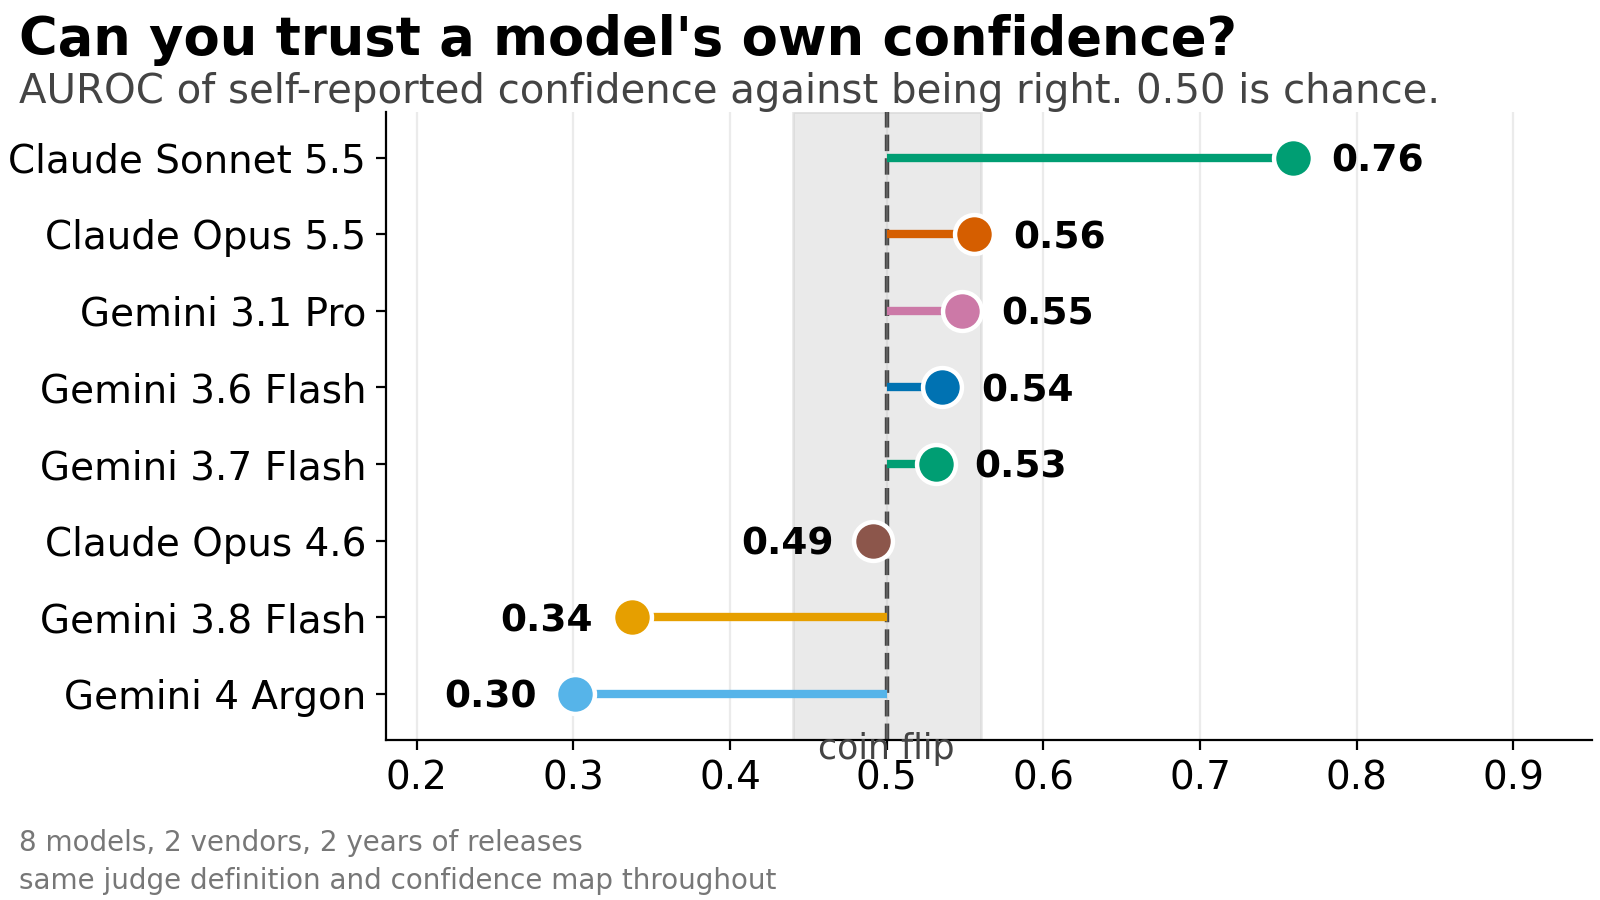
This is the question a trust gate depends on, and the answer has not changed in two years of asking it.
We ask every model how confident it is, then measure whether that predicted being right, as AUROC against naming the cause exactly. 0.50 is chance. Across the four models in this round and the four we measured in earlier rounds, one is usefully better than chance: Claude Sonnet 5.5, at 0.76, and it claims confidence on roughly one answer in ten. The rest sit between 0.30 and 0.56.
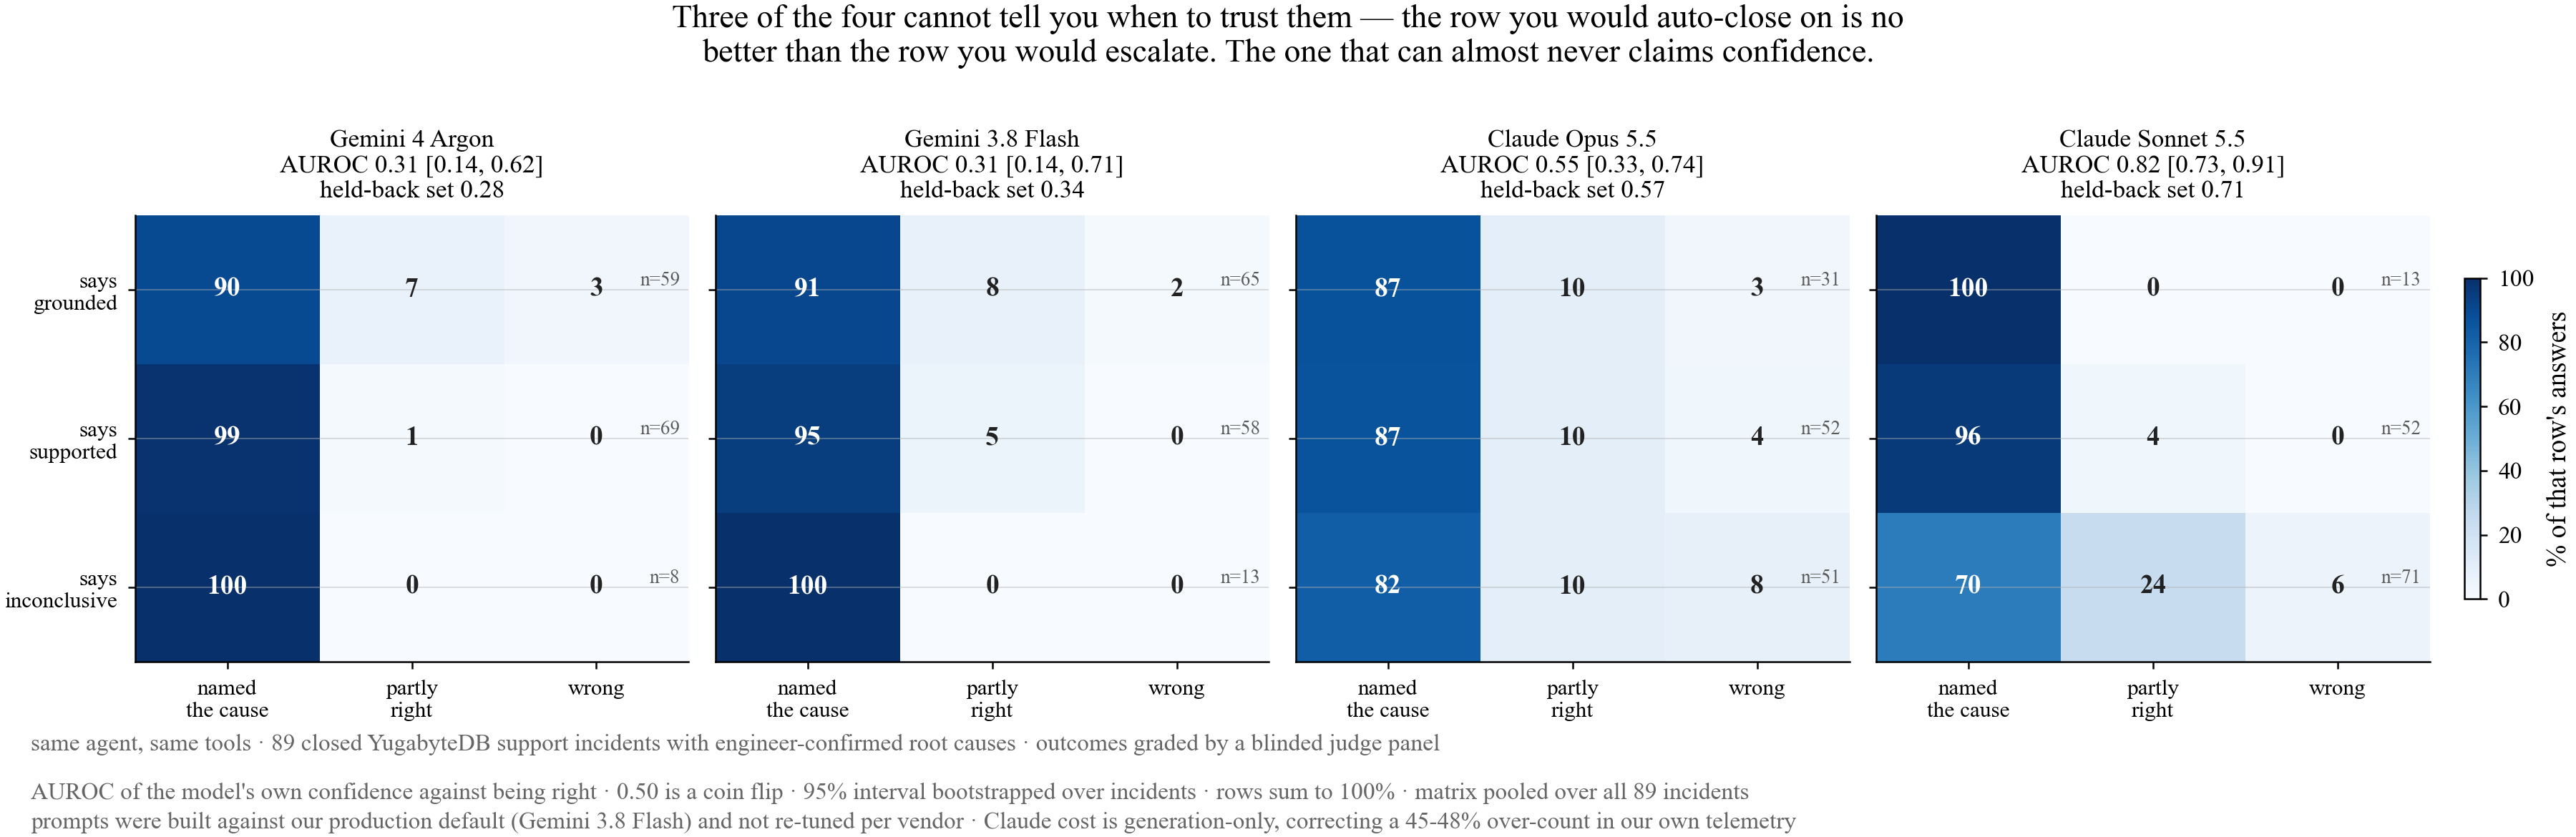
Read the matrix by row, because the row is the thing a production system would filter on. Across these models the row you would auto-close performs about as well as the row you would escalate.
The claim we are making and the one we are not. The defensible statement is that self-reported confidence carries no usable signal on this task. We are not making a directional claim about the arms whose values fall under 0.50. One of them has an interval that excludes chance on one of the two ticket sets, which is interesting and is not enough; a directional claim needs to replicate on a set chosen before it was observed, and that run has not happened. This report follows the same rule that retracted an earlier calibration claim of ours at larger n.
Our operating model follows from the usable-signal finding alone: the agent drafts, the engineer decides, and nothing anywhere is gated on what the model says about itself.
What the accuracy costs
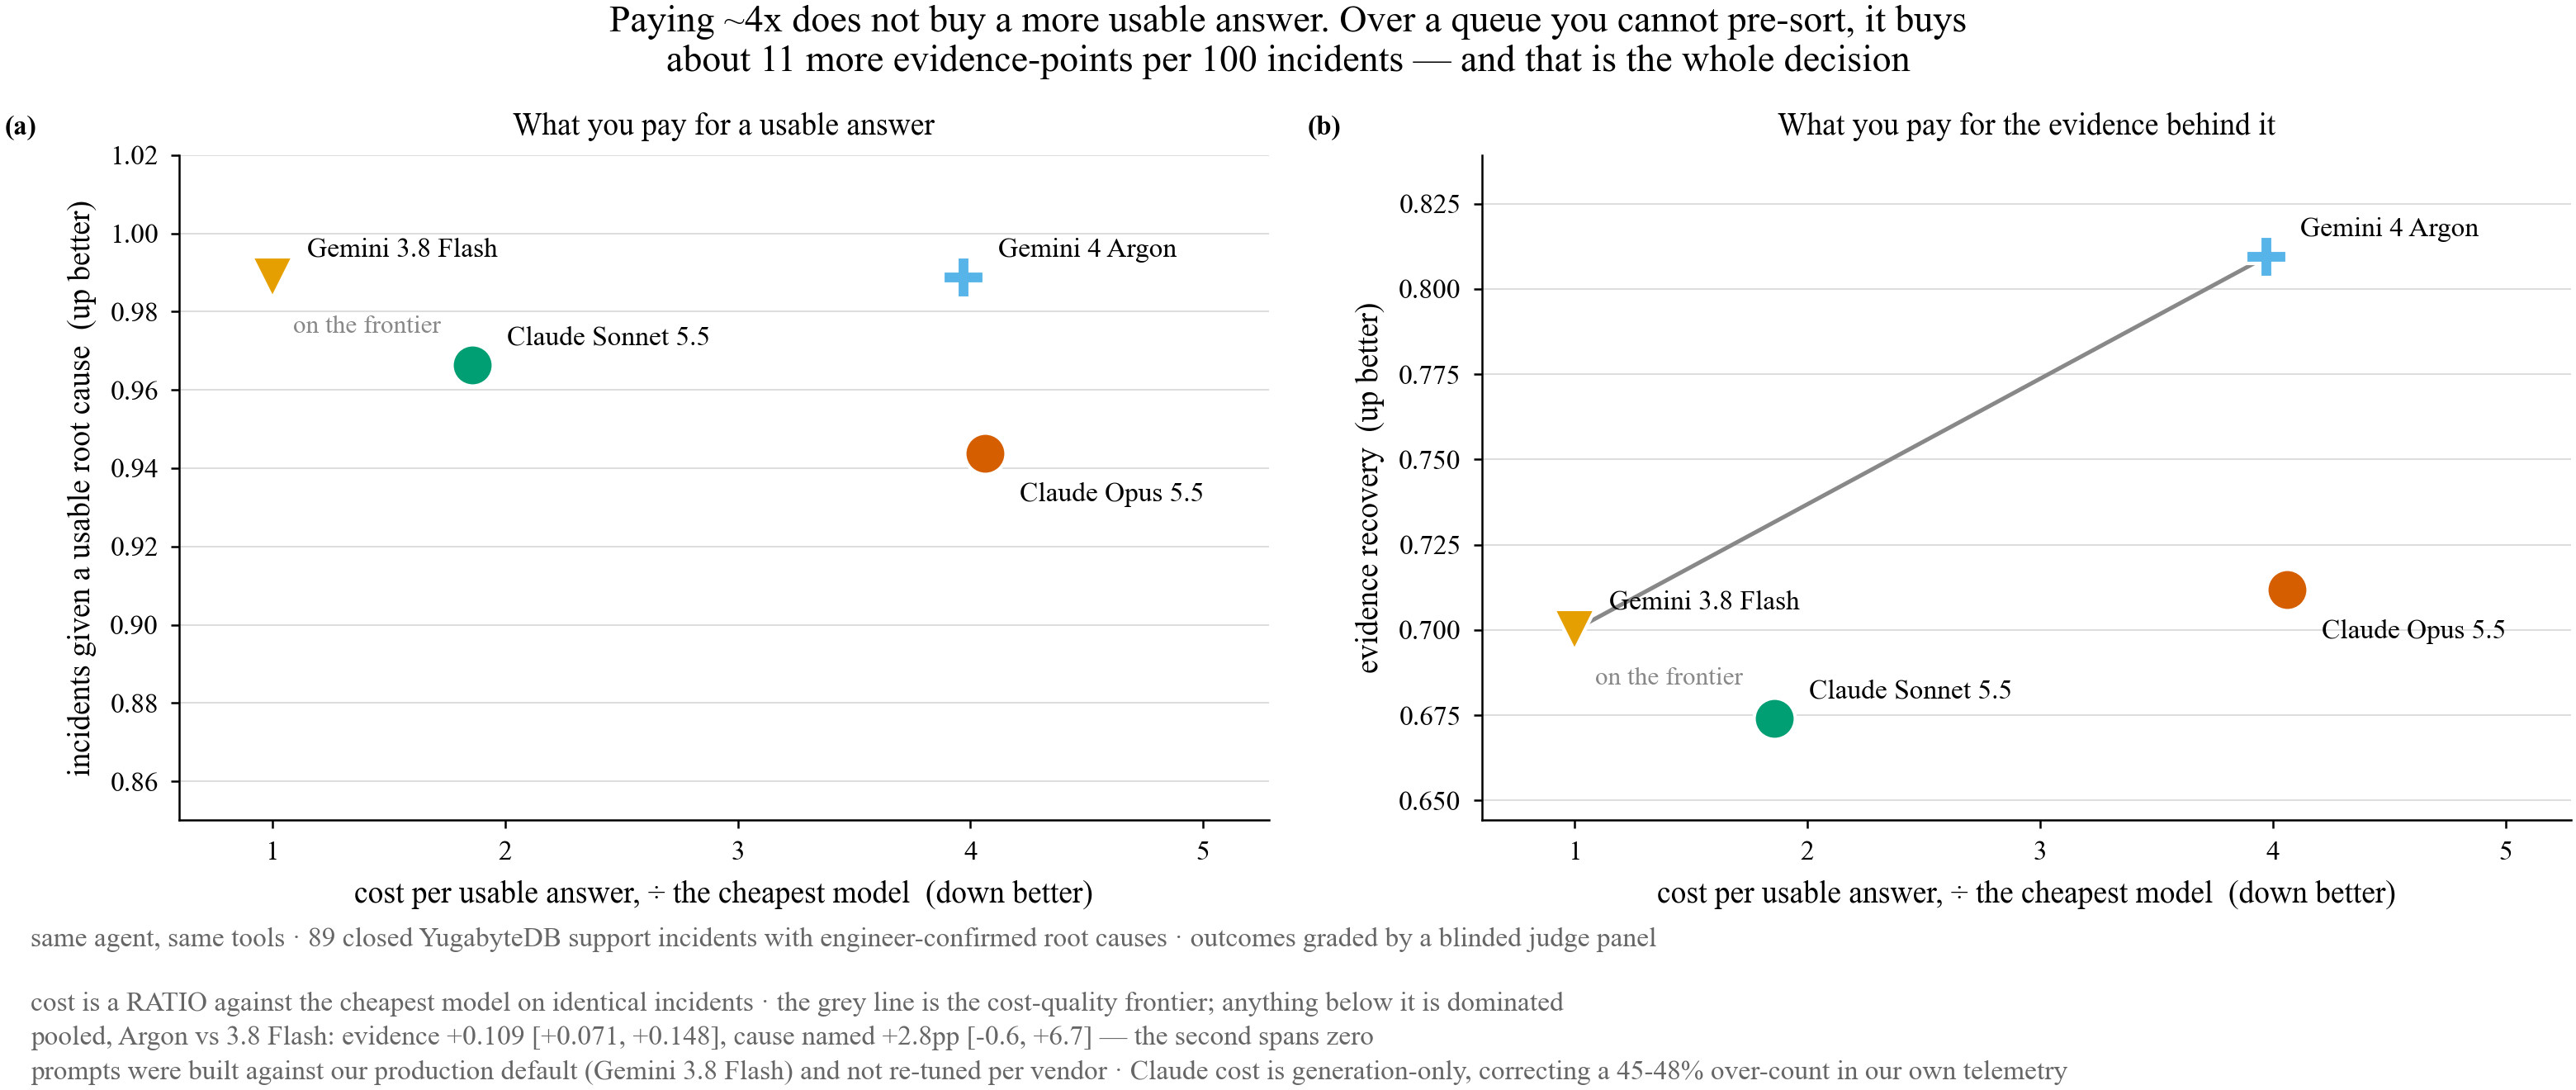
Argon costs about four times our production default per ticket, against a posted token rate of 2.67x. The difference is behaviour rather than price: it runs a tighter loop, half the turns per ticket, but reads more per turn and reuses the cache less, 62% against 82% on identical work. Opus 5.5 costs about the same as Argon and sits below the cheap arm on naming the cause.
Cost here is generation-only. Our own telemetry priced tool-result payloads at the model's output rate, which over-stated the two Claude arms by 45 to 48% and left the Gemini arms untouched; the figures use the corrected numbers.
A word on the model we currently run. Pooled over all 89 tickets, Gemini 3.8 Flash names the cause 92.1% of the time against 84.3% for Opus 5.5, matches Opus on evidence recovery, and ties Argon on the rate of usable answers, at about a quarter of the cost of either. It has been the workhorse of this queue and nothing in this round displaces it.
The routing plan that did not survive
The obvious decision is to route: cheap model by default, expensive model on the hard tickets, pay for capability only where it is needed. We could not make it work, and the reason is more useful than the plan.
We only know a ticket was hard once it is closed. Our label for "hard" is whether it was escalated to Engineering, which is known at resolution and not at intake. There is no signal at the top of the queue to route on.
The fallback is to let the cheap model escalate when it looks unsure, and that is exactly what the calibration result rules out. A self-report that carries no usable signal cannot be an escalation trigger.
So there is no routing policy available today, and the choice is one model for the whole queue. Pooled across all 89 tickets, always paying four times more buys about eleven more evidence-points per hundred tickets, with the rate of correctly named causes holding steady.
That turns the decision into a capacity question rather than a benchmark one. Eleven evidence-points per hundred tickets is worth paying for if a complete chain saves an engineer an hour on an escalated ticket, and worth nothing if they would have pulled the same logs anyway. We are instrumenting handling time on escalated tickets now, because that is the number that settles it, and I would rather hold the spend than approve it on a benchmark result.
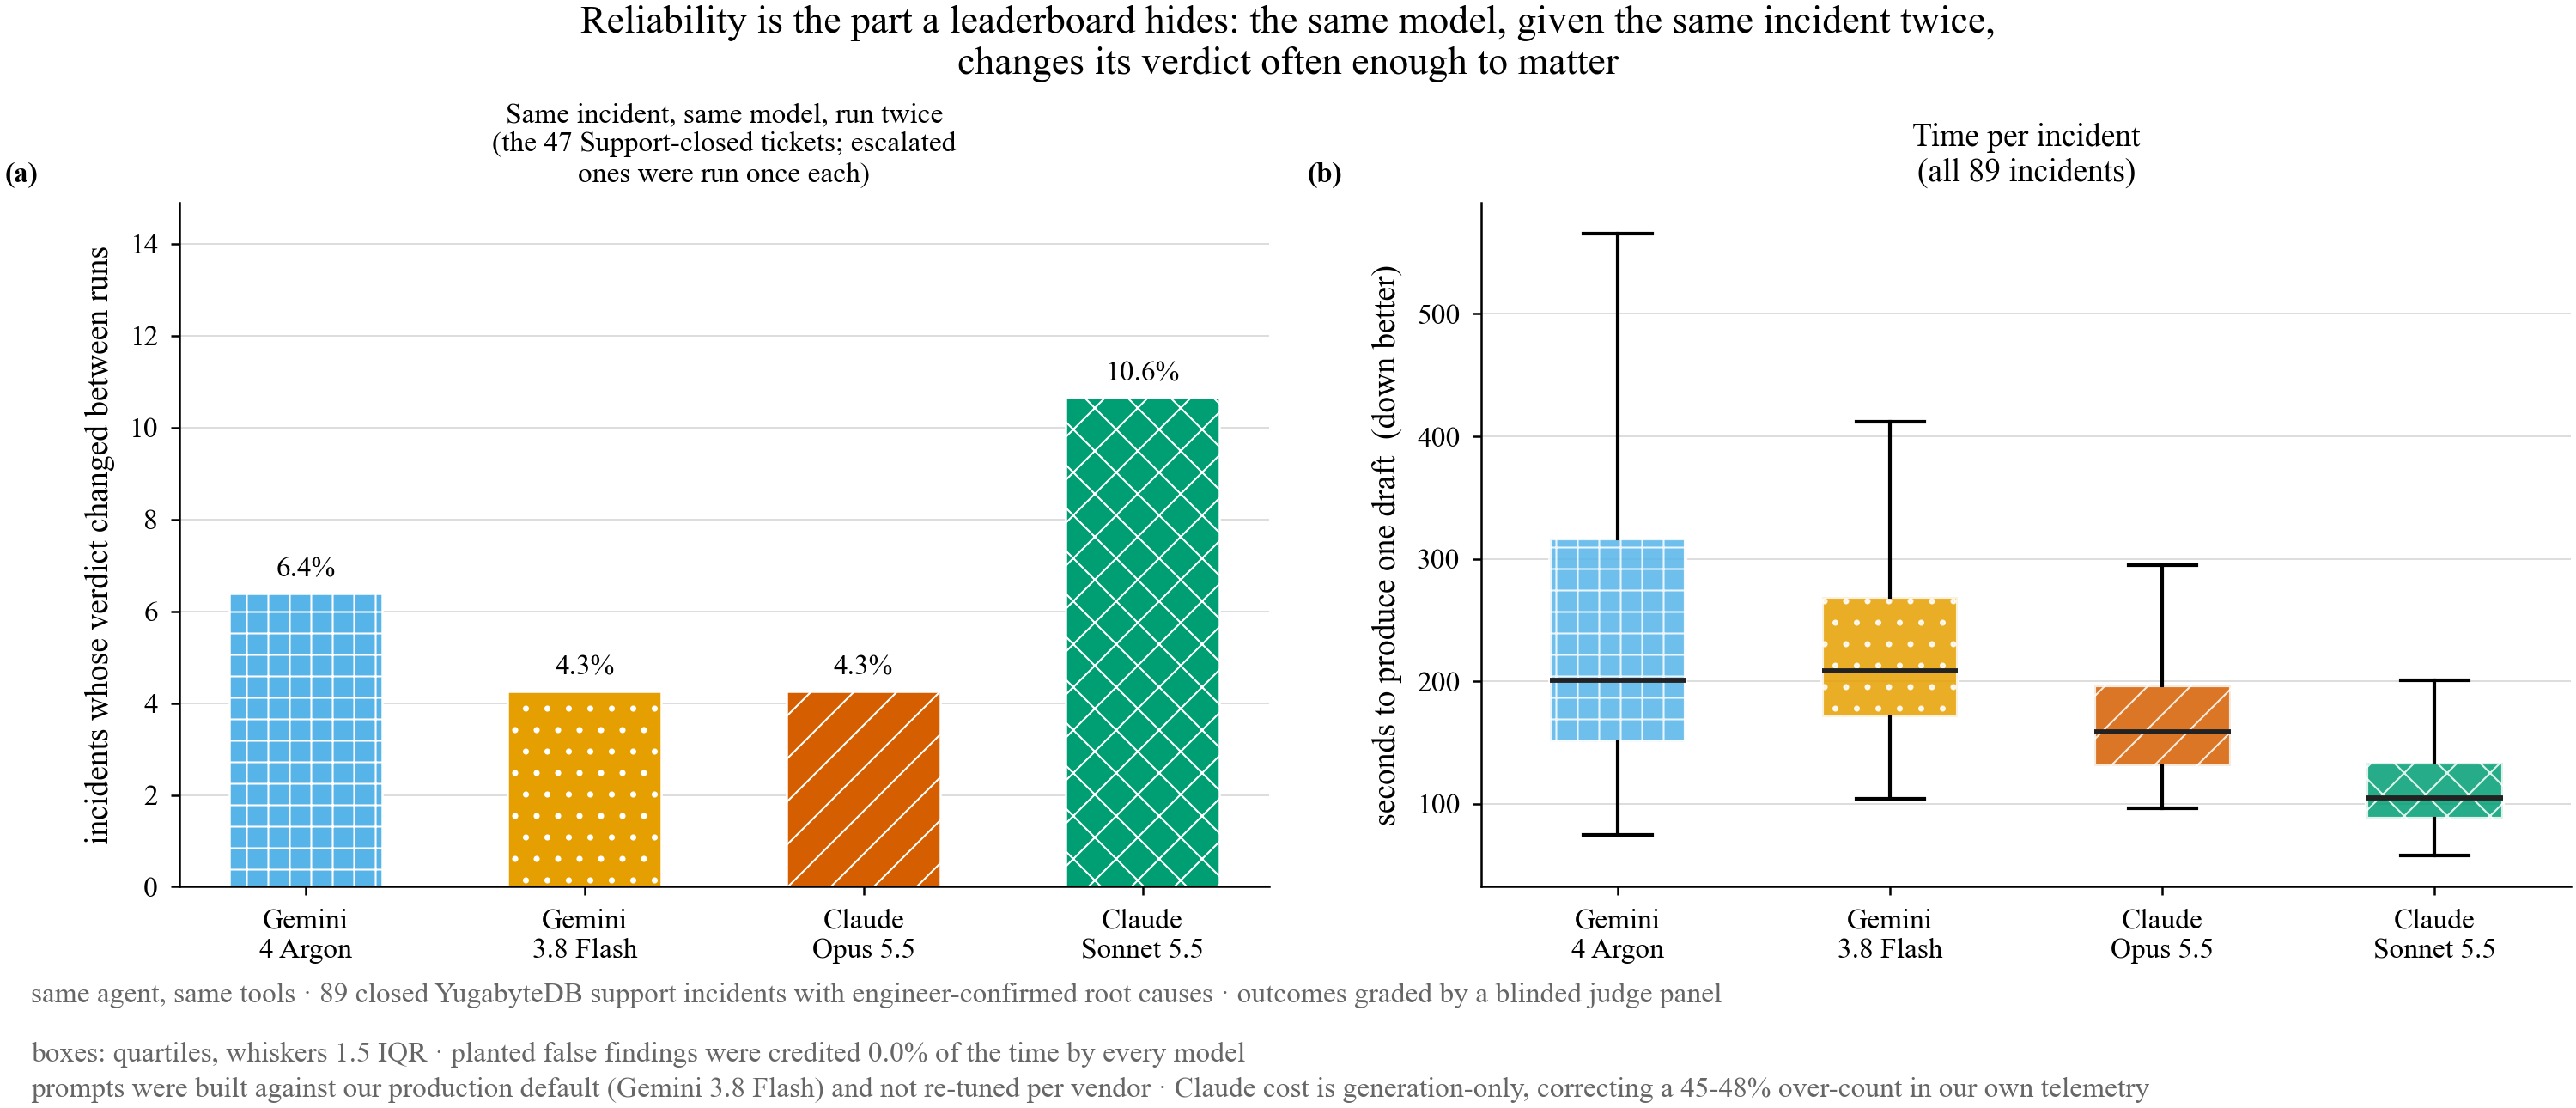
One more thing a leaderboard hides, and it matters more in service delivery than in research. Give a model the same ticket twice and it sometimes changes its verdict, between 4.3% and 10.6% of tickets depending on the arm. Two customers with the same symptom can get two different assessments, and an engineer who sees that once discounts the next twenty drafts. Predictability is part of the service, so that variance costs more than its size suggests. It stays survivable while a human reads every draft, and it becomes the binding constraint the moment anything acts on a single run.
What would change my mind
- A routing signal available at intake. If some property of the ticket at arrival predicted escalation, the cost argument reopens immediately.
- A calibrated model. One arm is already usefully calibrated. If that generalises, a trust gate becomes possible and our operating model changes.
- The harness, not the model. A fixed model scores very differently on our current agent than it did on the one behind the earlier report, which means our own tooling is a larger lever than the model choice. A run isolating that was still in flight when this was published, and nothing here is claimed on it.
- Evidence recovery not surviving contact with the people who use it. The measure is scored against findings an engineer confirmed were needed. If engineers tell us a complete chain does not save them time, the headline result stops mattering.
Method, and the previous round
The method, the pre-registration discipline and the retraction policy are unchanged from the first report in this series, which covers the harness, the judge panel and the standing evaluation set in more detail: Putting an agent on the incident queue.
Numbers behind every figure are in numbers.json beside this report. The study repository
is private, because the tickets are real customer diagnostic bundles.