Putting an agent on the incident queue: what I measured before I trusted it
- Published
- Data
- evaluation set of 102 closed incidents, 5 arms, wave 2 + 3.8 Flash round
- Figures
- 10
The claim
I run Applied AI and Support at Yugabyte. Both halves of that title report to the same outcome: how well, and how soon, we help a customer who needs us. So when we put an AI agent in front of the support engineers, the question was never "which model scores highest". It was: can an engineer act on what this agent says, how often will it cost them time, and can we tell in advance.
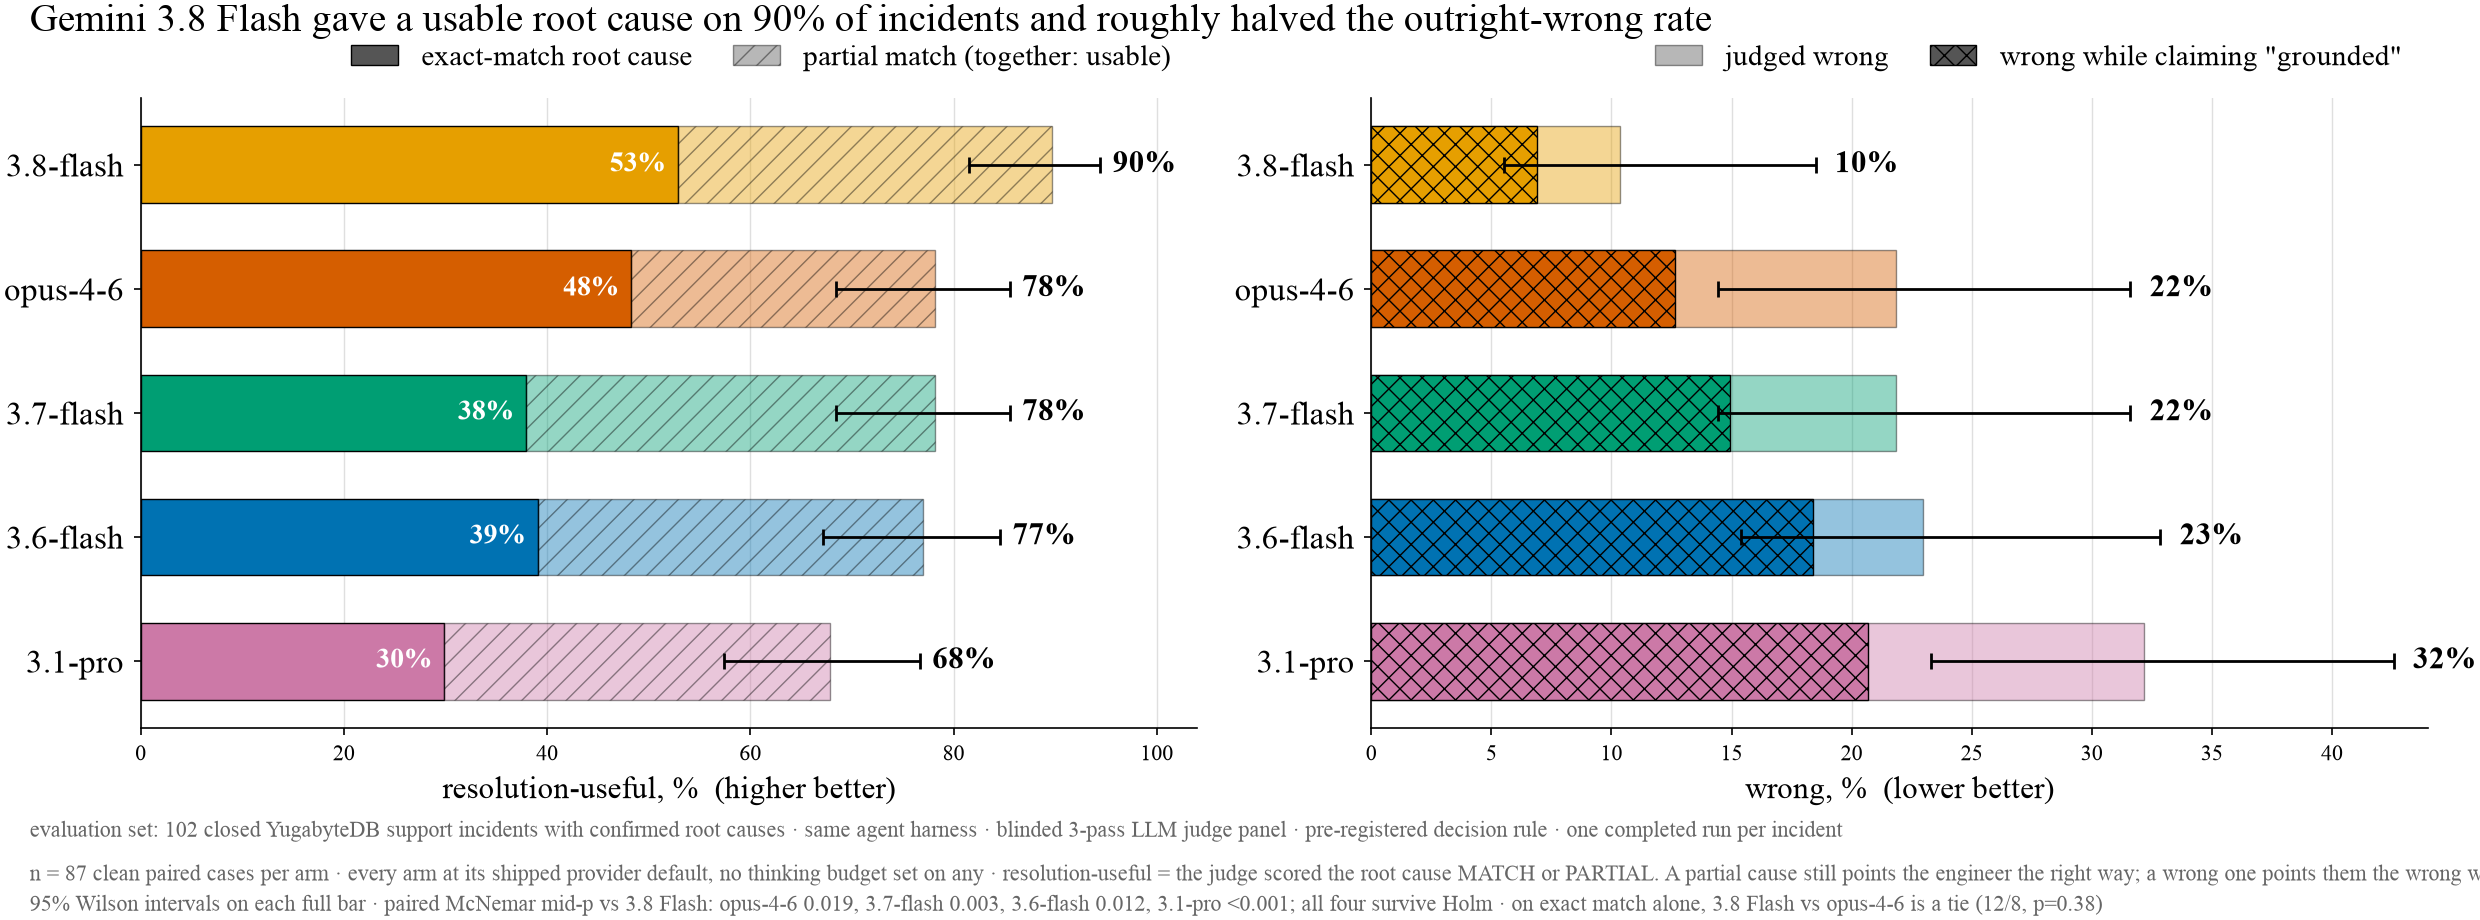
On our evaluation set of 102 closed incidents the answer is: usable root cause 90% of the time, outright wrong 10%, and no: the agent's own confidence label tells us nothing about which is which. Those three numbers, not a benchmark, decided our operating model. The agent drafts. The engineer decides. Nothing is gated on what the model says about itself.
This report is also a correction. Three weeks before, I had praised a model's calibration in public on 25 incidents. At 102 that claim died. Leaders who adopt AI in operations will be wrong in public sometimes; the discipline is to measure at the scale that can prove you wrong, and say so when it does.
The operational questions
When a customer's cluster misbehaves, an engineer opens a diagnostic bundle (logs, metrics, cluster state, often gigabytes) under time pressure. Our agent, Hagen, reads the bundle through a set of tools and writes a root-cause assessment before the engineer starts.
For the person accountable for the queue, four things about that assessment matter:
- Is it usable? An exact root cause, or a partial one that points the right way, cuts time to resolution. We count both as usable and report exact match beside it.
- Is it wrong? A confidently wrong cause sends the engineer down the wrong path. It raises time to resolution instead of lowering it. Wrong is the cost, not the absence of exact.
- Can we tell which is which before the engineer acts? If the agent's own "grounded" label predicted correctness, we could gate on it. That is the question a trust gate depends on.
- What does each run cost, in money and in minutes? That is what the budget and the queue depend on, and price per token turned out to predict neither.
Everything below is those four questions, measured, and what we decided on each.
How we measured it
Cases. Our evaluation set: 102 closed support incidents with independently confirmed root causes: customer-escalation records or session validation, not the pipeline's own output. This is a test harness, not live traffic. Every change to the stack, whether a model swap, a new tool or a prompt change, runs against the same 102 cases and is scored the same way, so quality is measured before it reaches an engineer, and regressions show up as a number rather than a complaint. The set started at 25 cases. We expanded it to 102 after finding 25 too small to separate models: differences of ten points came and went between runs, and one of the wrong conclusions below was drawn on it. 92 of the 102 are scored under the standard rule; 5 of those had their evidence change between the two run windows, so every rate below is on the remaining 87 unless stated.
Agent. One production support-RCA agent (pydantic-ai and MCP tools), one system prompt, one tool set, provider-default settings for every model. Nothing tuned per arm. The model is the only variable.
Arms. Five: Gemini 3.6 Flash, 3.7 Flash, 3.8 Flash, Gemini 3.1 Pro, Claude Opus 4.6. The Claude arm is the mechanism control for the cost finding: it is the one model that batches tool calls.
Scoring. A blinded panel of two judge models, three passes each, scores every answer against the human root cause as MATCH, PARTIAL or MISS. Usable = MATCH or PARTIAL. Wrong = MISS.
Pre-registration. The decision rule and analysis plan were committed to git before the runs were scored. Exact match was the pre-registered primary metric. I moved to usable as the lead after judging, for the operational reason in question 1, and I show both everywhere.
Telemetry. Every model call and tool call is traced. Turns, tool calls, tokens and wall clock come from those traces, one completed run per incident, medians unless stated.
Questions 1 and 2: usable, and wrong
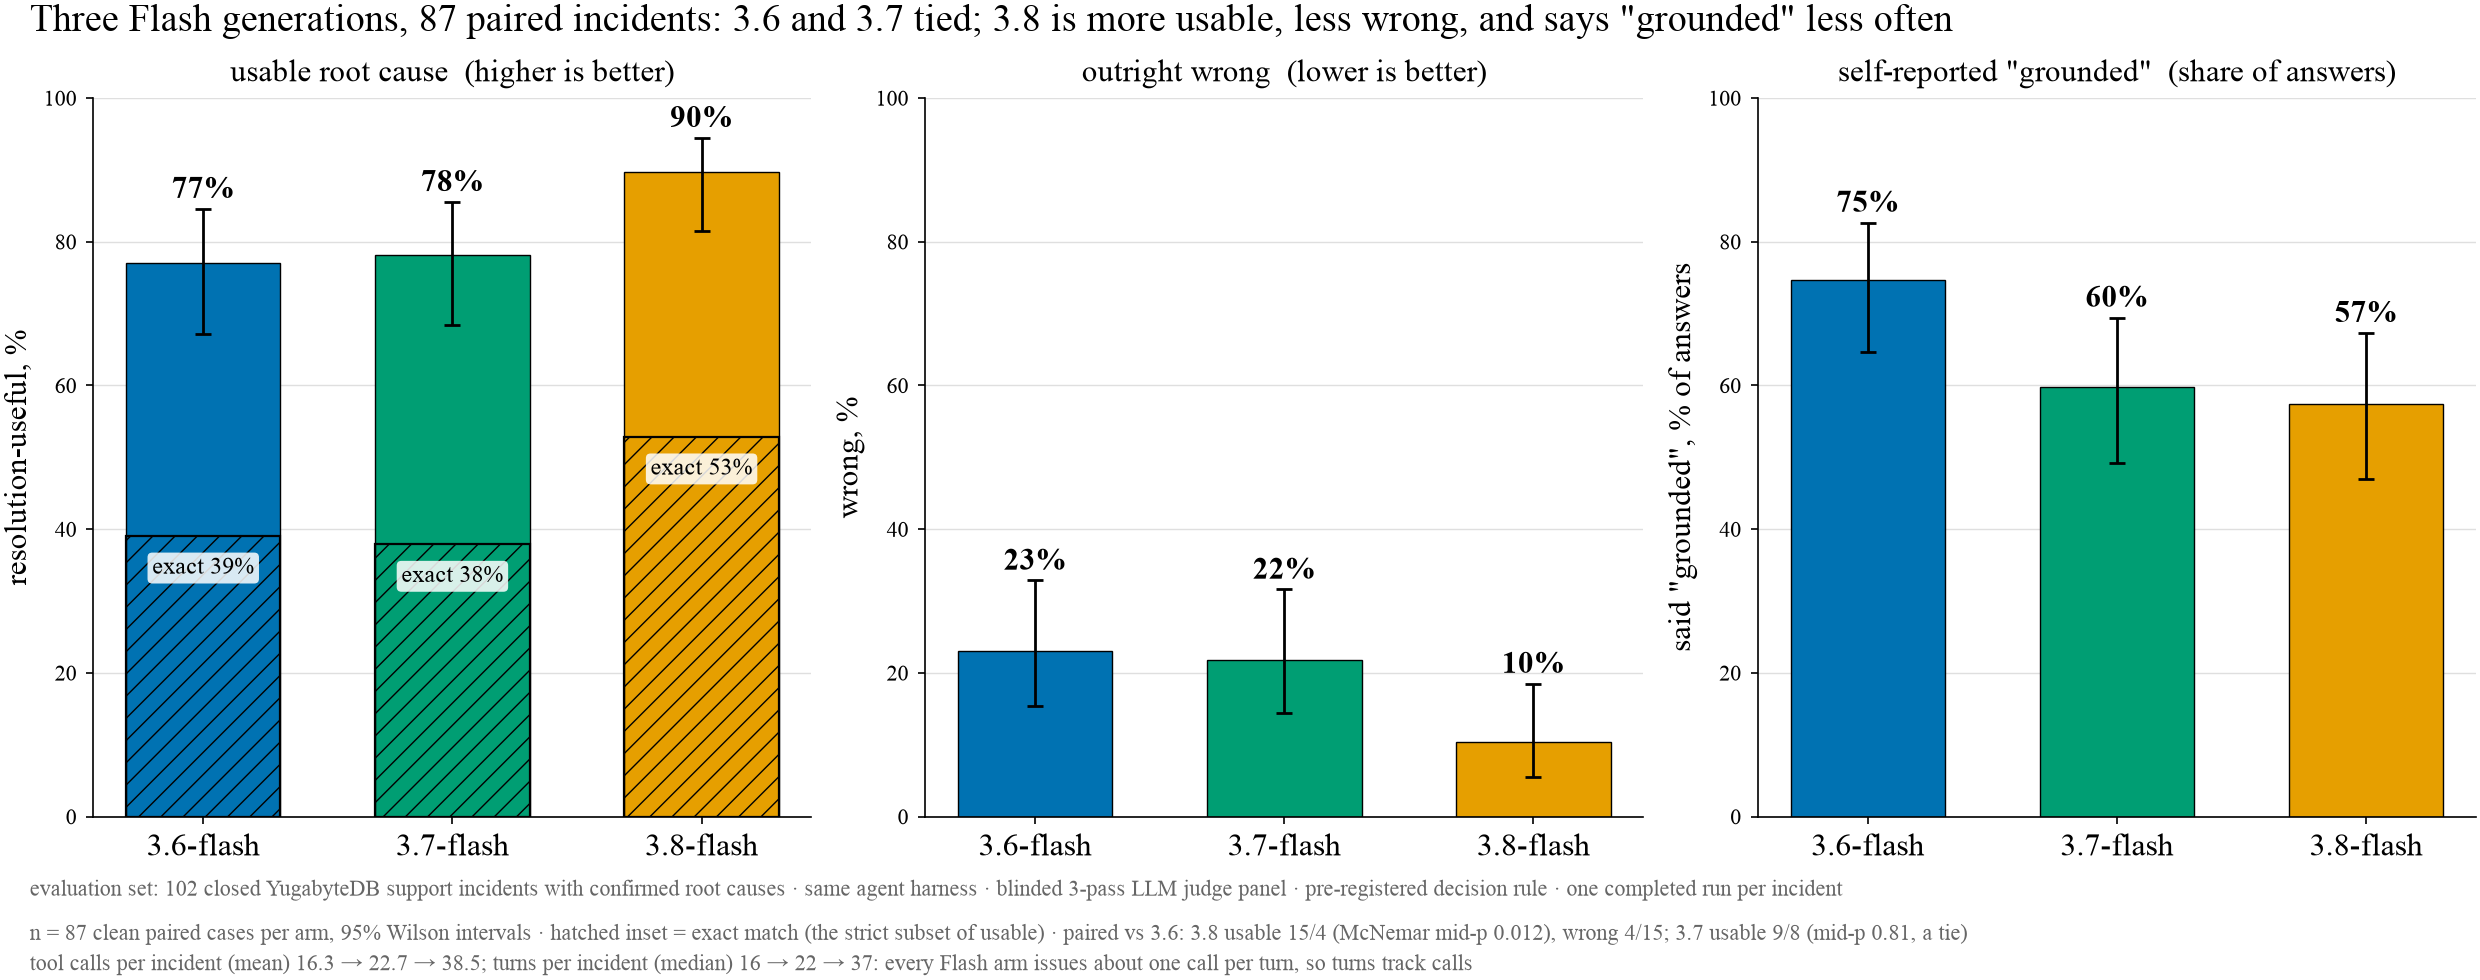
| arm | usable | exact | wrong | said "grounded" |
|---|---|---|---|---|
| Gemini 3.6 Flash | 77% | 39% | 23% | 75% |
| Gemini 3.7 Flash | 78% | 38% | 22% | 60% |
| Gemini 3.8 Flash | 90% | 53% | 10% | 57% |
Three releases of the same model line on the same incidents. 3.6 and 3.7 ran in August, 3.8 in September; on 25 identical incidents we measured the backend moving under one model in that window, so read the gap as release plus window. 3.6 and 3.7 tied. 3.8 is more usable, less wrong, and labels itself "grounded" less often while being right more often. Paired on the same incidents, 3.8 Flash was usable where the strongest comparison arm was not in 14 incidents, and the reverse in 4 (McNemar mid-p 0.019); all four paired comparisons survive Holm correction. On exact match alone the same pair is a tie, 12 to 8 (p=0.38).
Operationally: one in ten assessments still sends the engineer the wrong way. That number, not the 90%, sets the supervision model. The agent drafts; the engineer decides.
Question 3: can the agent's own confidence be the gate?
No. And I had said otherwise.
In August I wrote that Gemini 3.6 Flash "matched its confidence to its correctness as well as any model we tested". On the original 25-case harness that was true: AUROC 0.62, MCC +0.36, the best of eight models. On the expanded 102 it was not: AUROC 0.473, MCC −0.075. The claim was made on a set too small to hold it, and expanding the harness is what exposed it.
Confidently wrong answers rose from 16% to 20% overall, and on the identical 25 incidents from 16% to 24%, so part of the change was the backend moving under the model, not only harder cases.
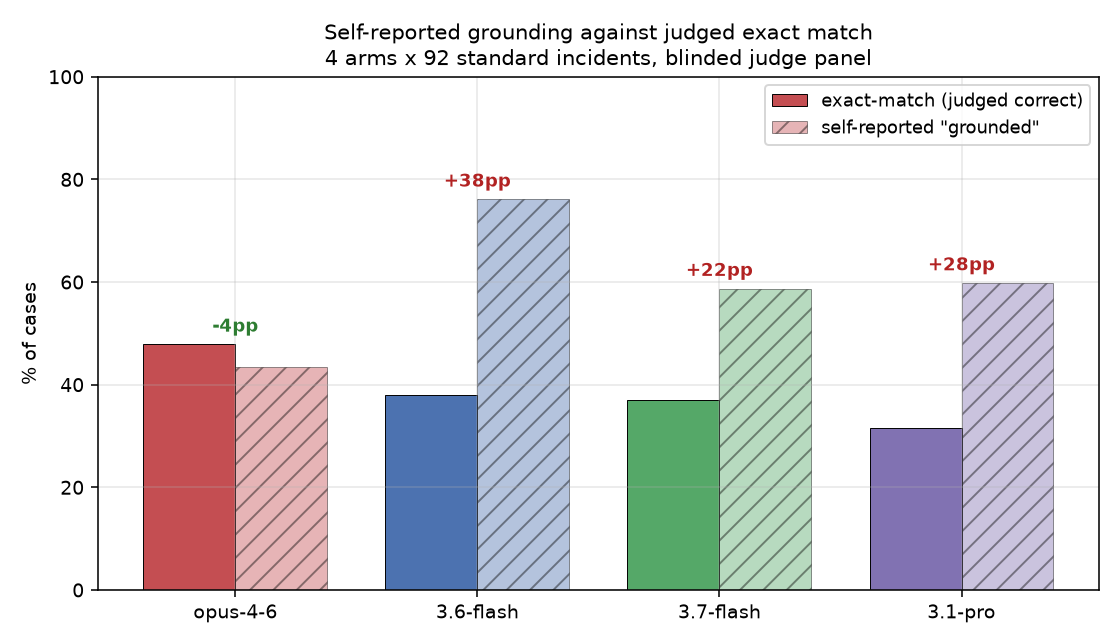
Across all four Wave 2 arms, a graded proxy built from the models' own grounding and confidence labels predicted whether the answer was usable (exact or partial) at AUROC 0.460 (cluster permutation p=0.315). The binary "grounded" flag alone, against exact match: AUROC 0.518, p=0.661, bootstrap CI 0.447 to 0.580. A coin flip scores 0.50. Self-reported confidence carries no usable signal.
Over-claiming also differs by vendor. These figures are the 92-case Wave 2 standard set, not the 87-case paired set in the table above, so each moves by a point. 3.7 Flash said "grounded" on 59% of incidents and was exactly right on 37%. 3.6 Flash: 76% and 38%. The Claude arm under-claimed: 43% and 48%. One trust threshold across models is invalid, and the sign flips between vendors.
The operational consequence is the most important one in this report. We had stopped gating production on the agent's self-report before this run. The data says that call was right. What we do instead: the engineer sees the assessment and the evidence it cites, never a confidence badge, and where two arms disagree they see the disagreement.
What it costs to run: turns, not tokens, not price
For an operations budget the unit is cost per incident, and price per token predicts it badly.
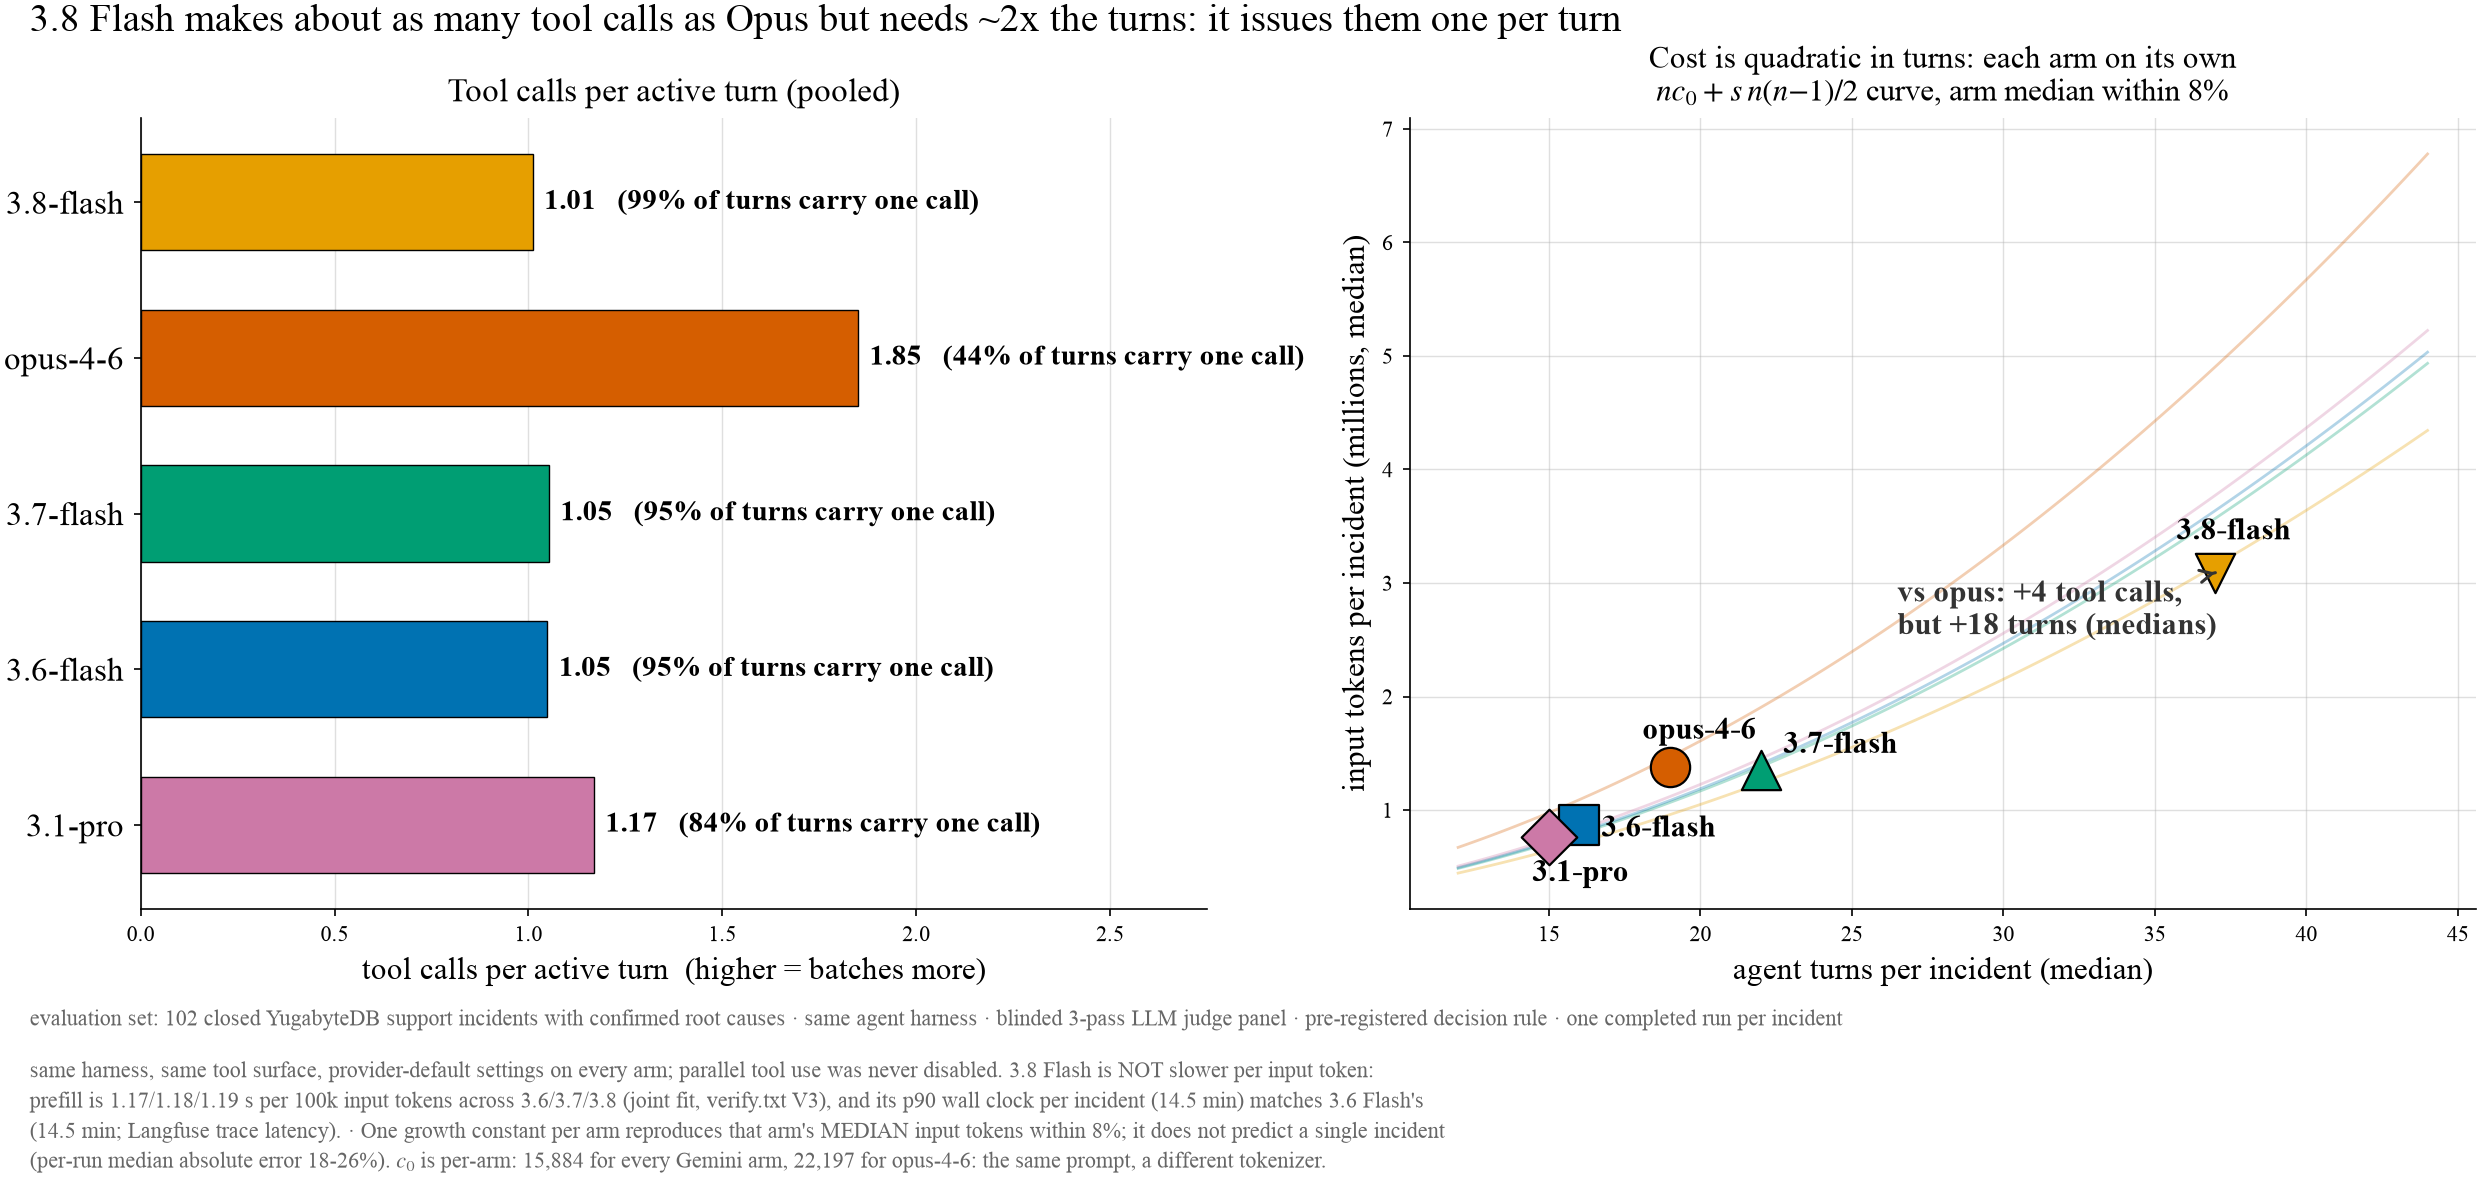
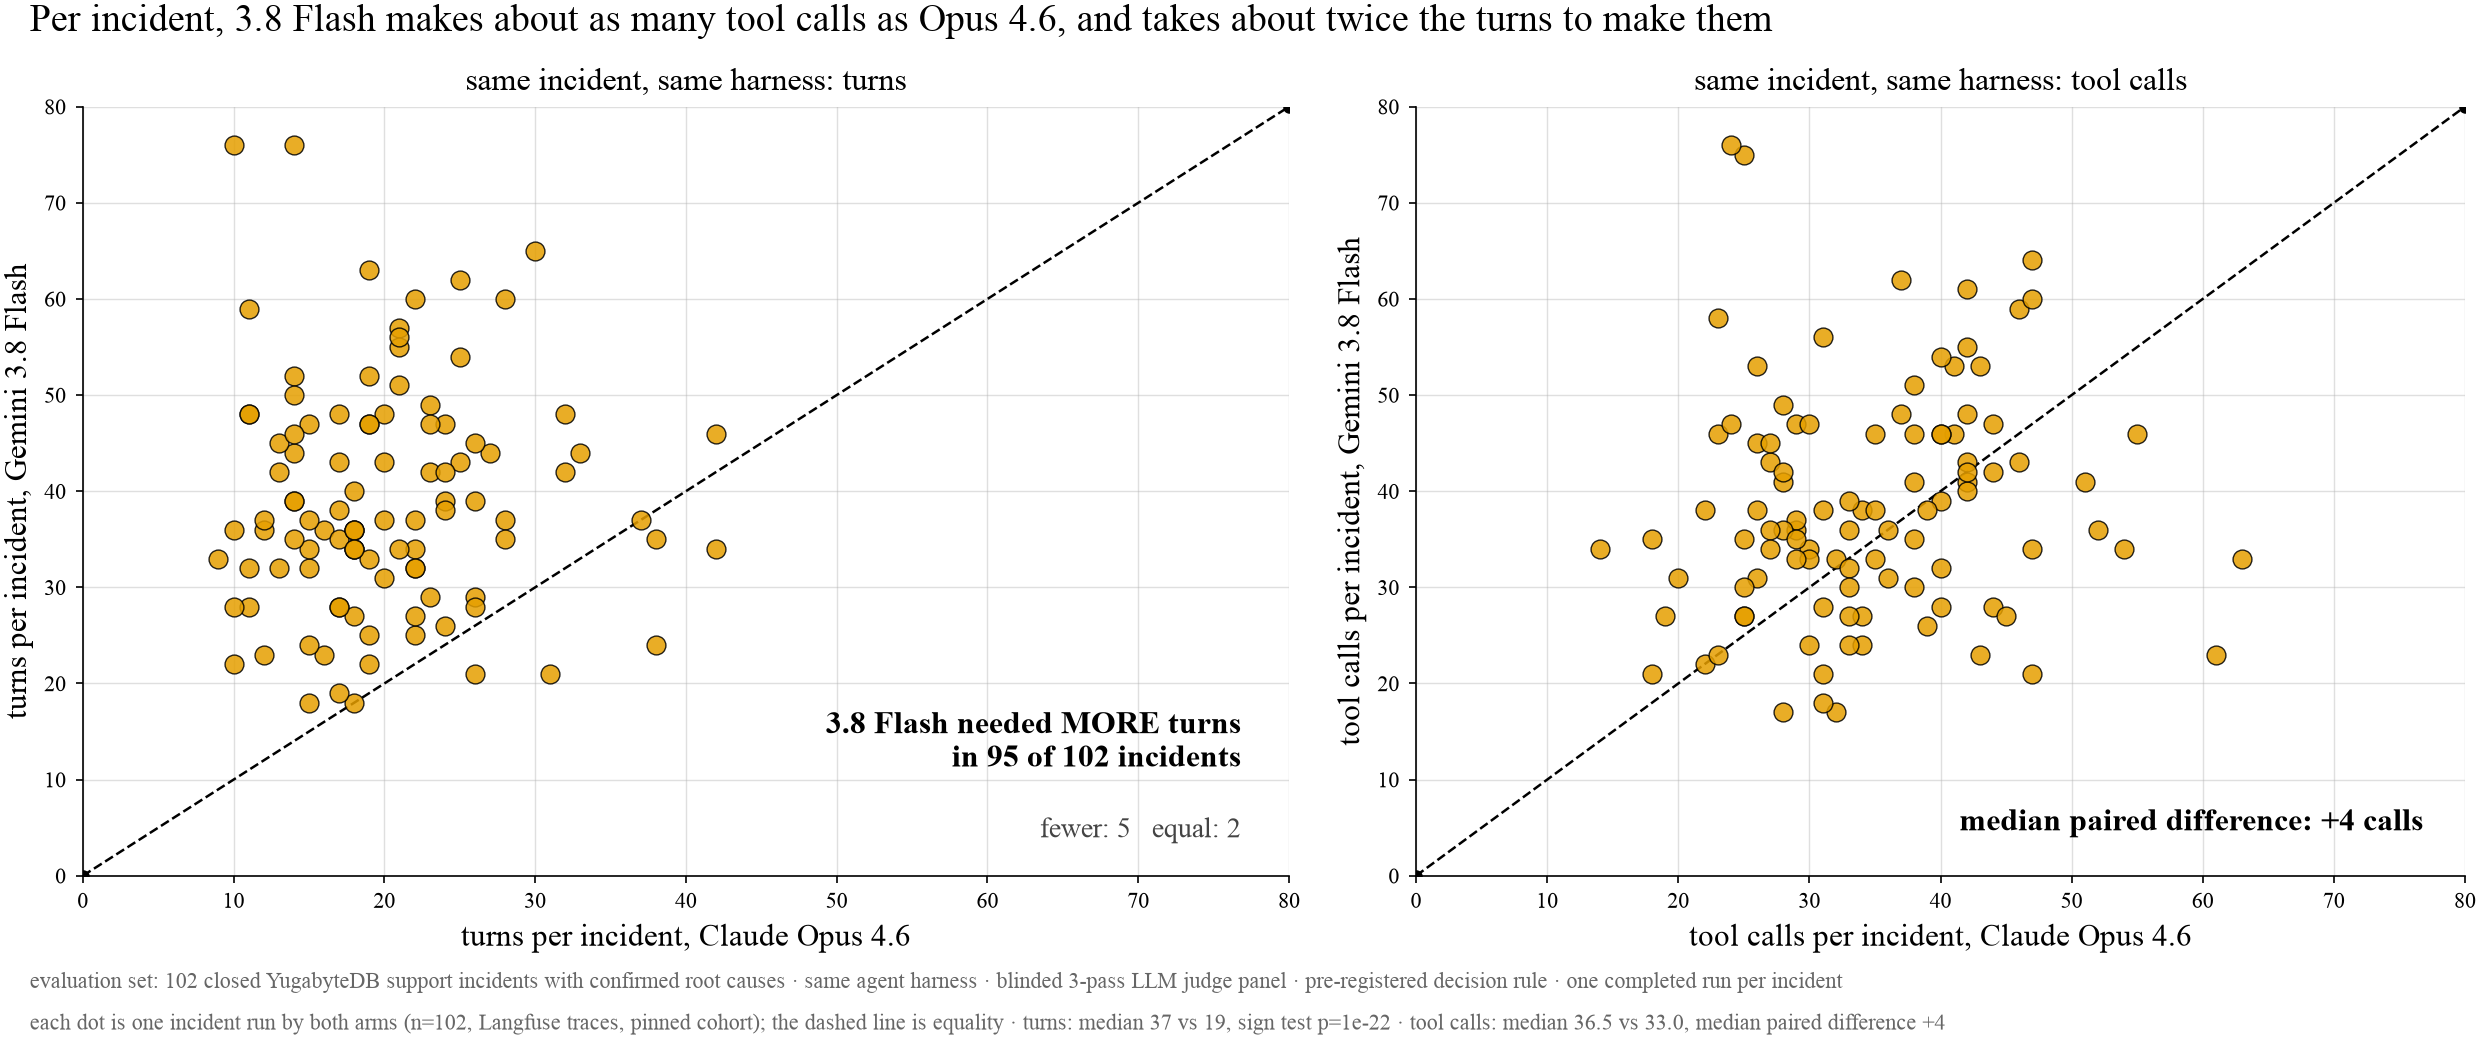
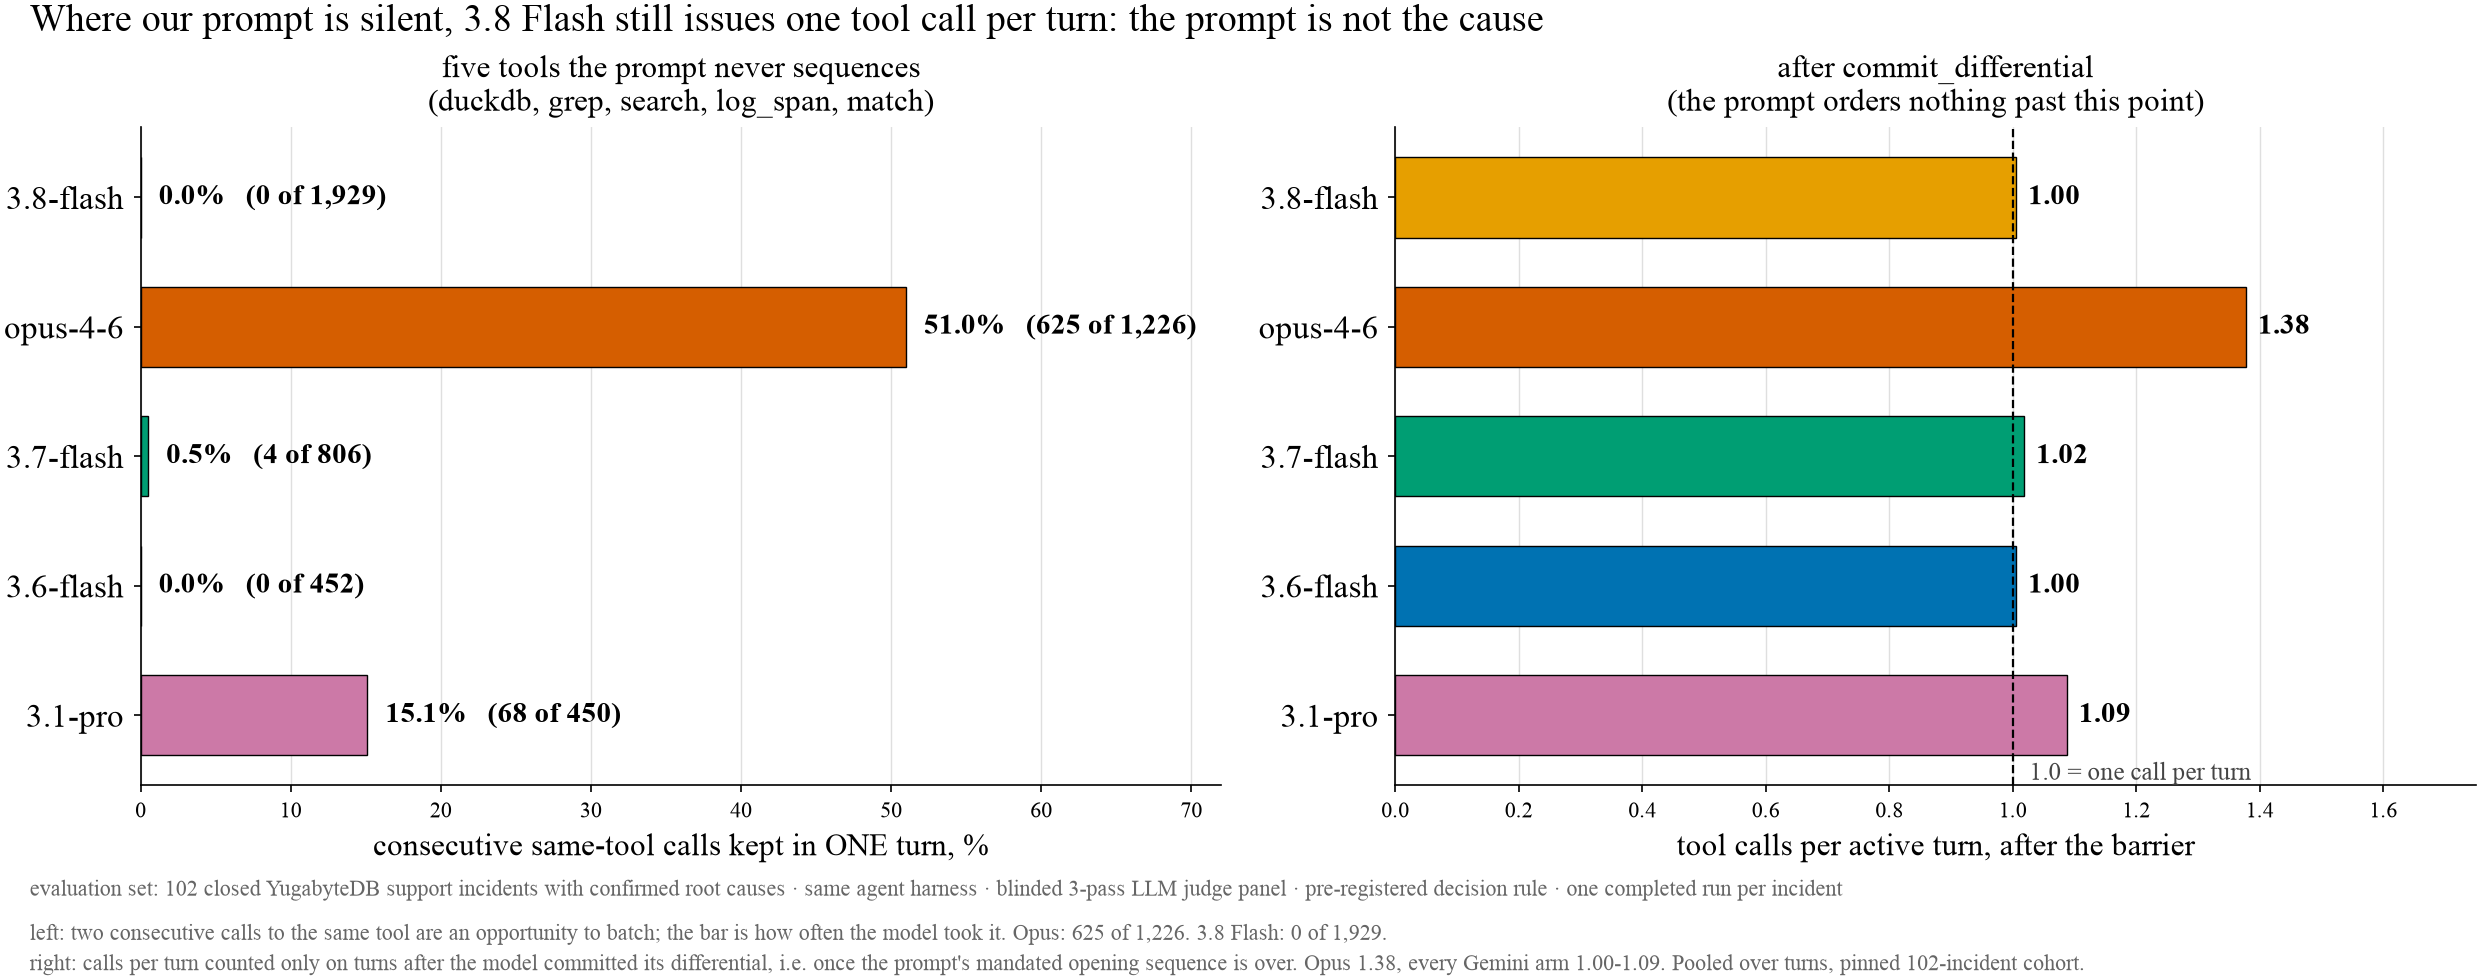
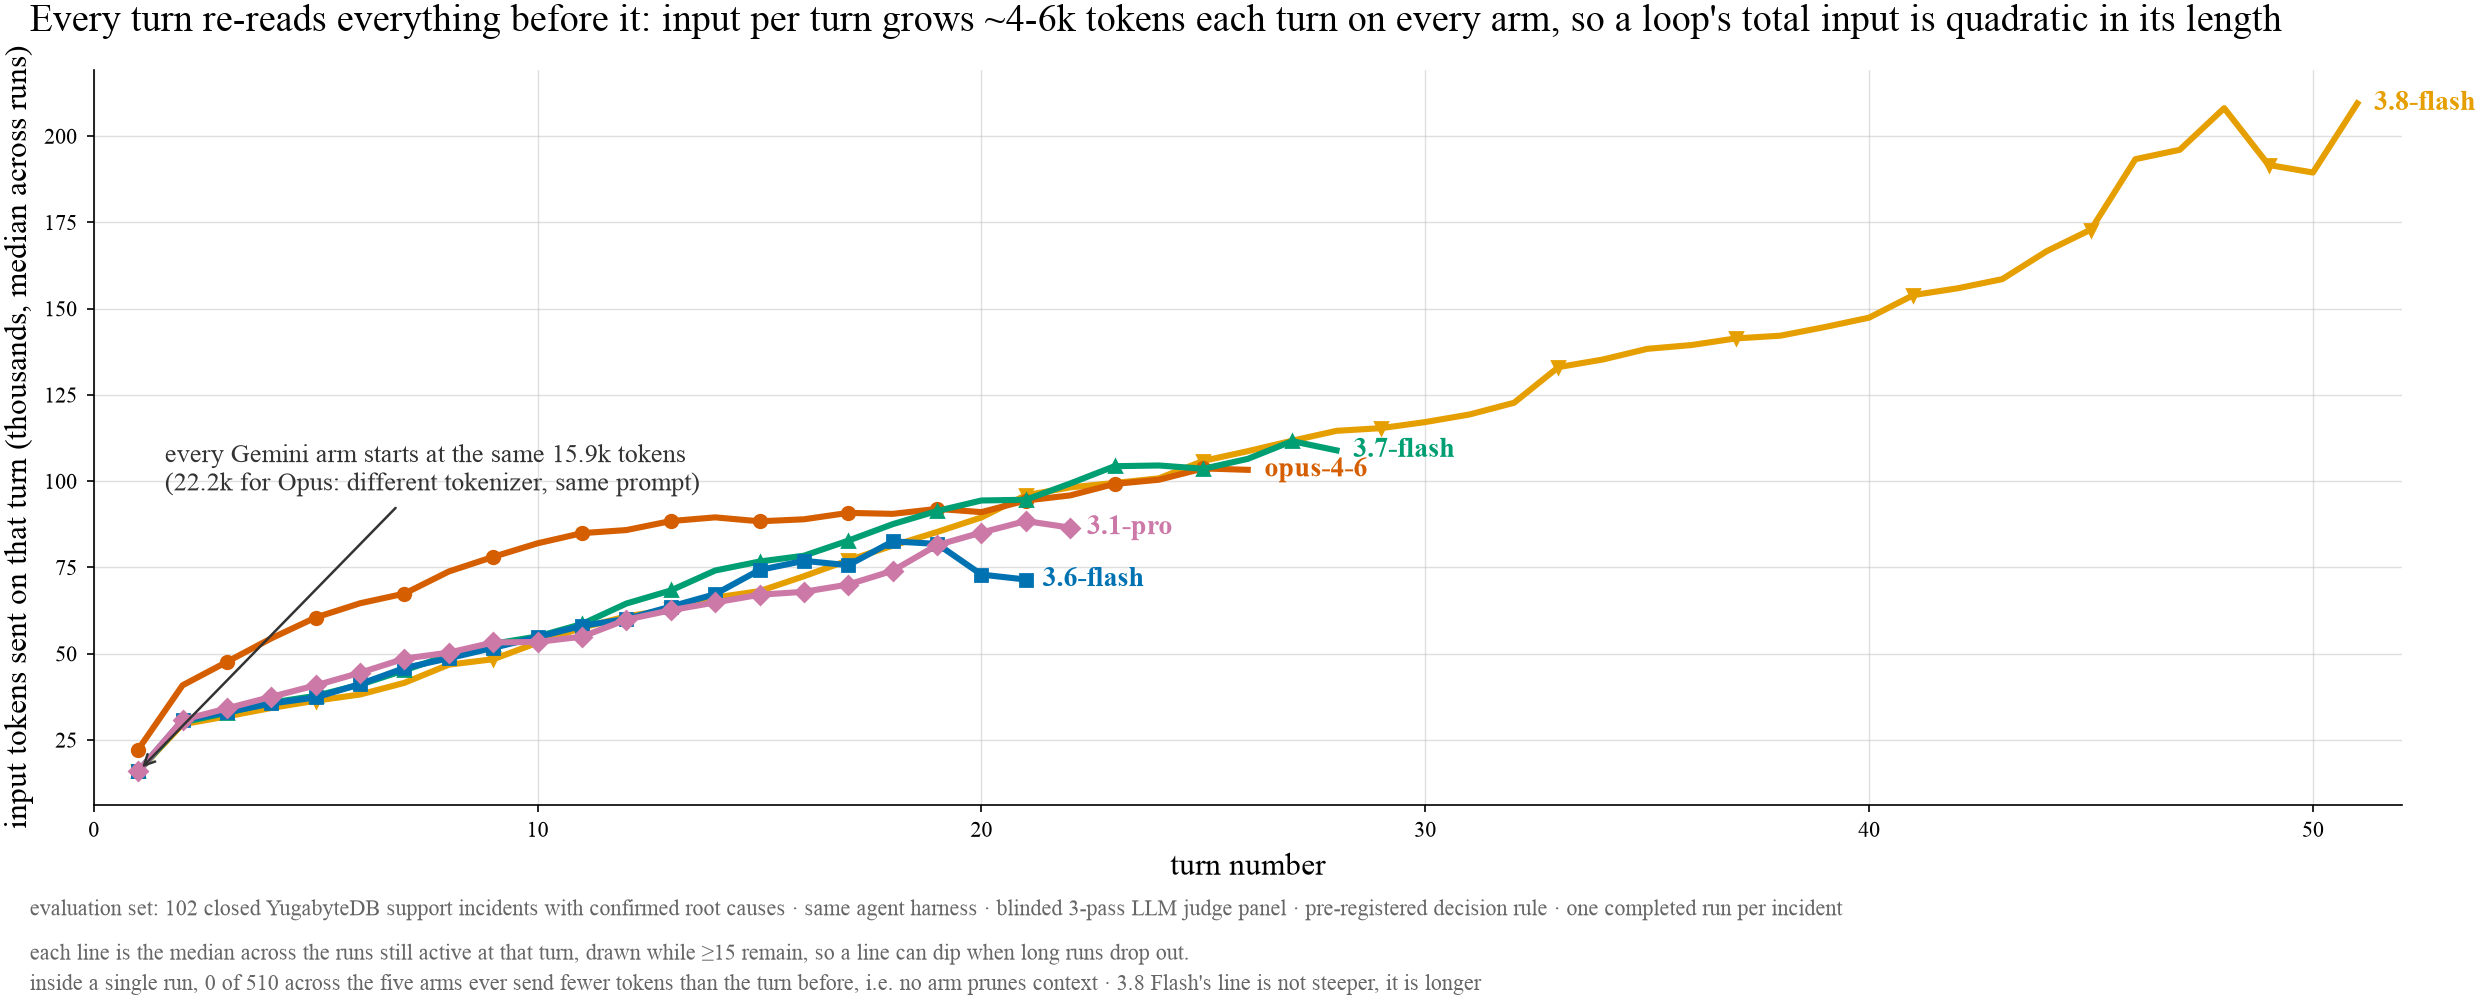
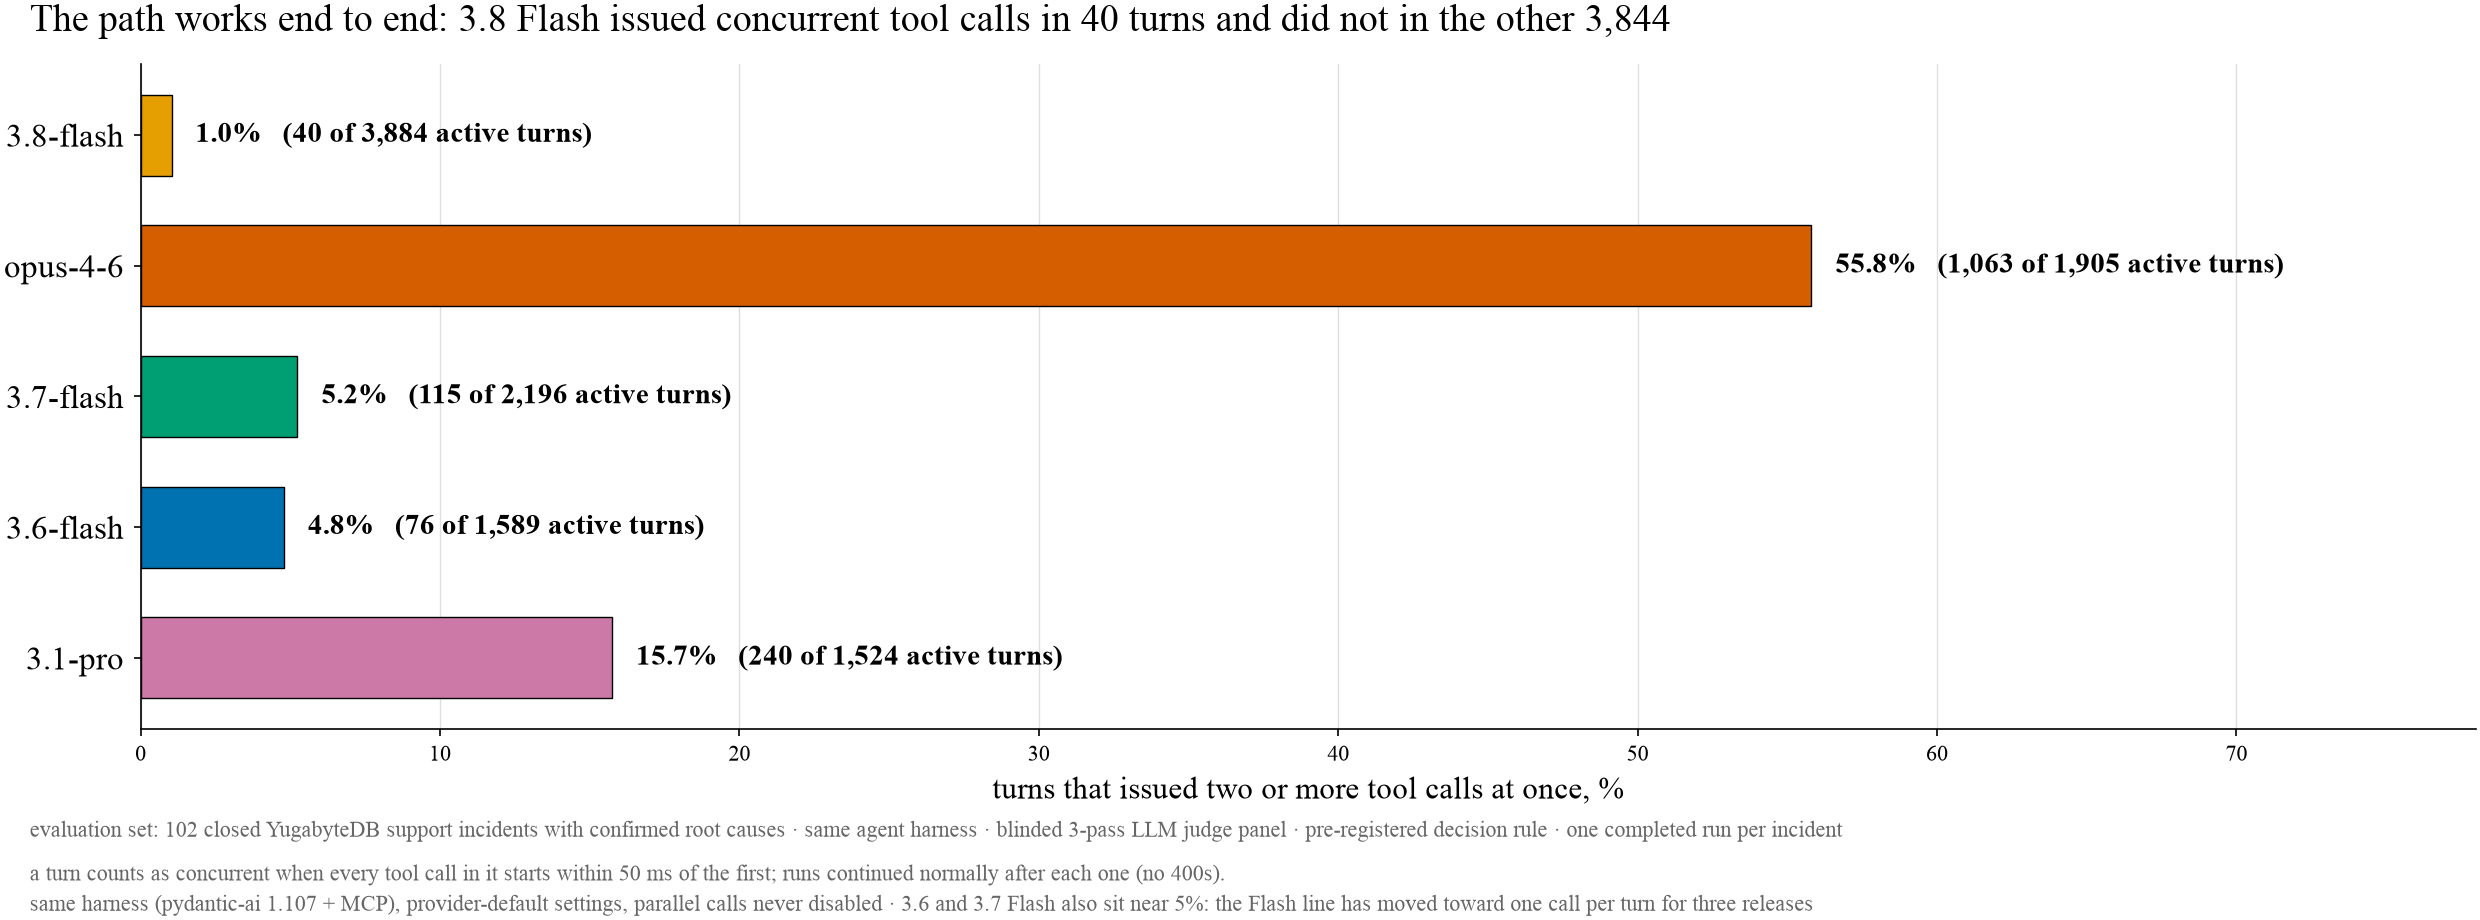
Gemini 3.8 Flash issues 1.01 tool calls per active turn; 99% of its 3,884 active turns carry exactly one call. Inside Gemini's own line the share of single-call turns runs 84% (3.1 Pro), 95% (3.6 Flash), 95% (3.7 Flash), 99% (3.8 Flash), through the identical client, so the client passes parallel calls whenever a model issues them. The comparison arm issues 1.85. Per incident the two make about the same number of calls (median 36.5 against 33), but 3.8 Flash needs 37 turns to the comparison arm's 19, and took more turns in 95 of 102 paired incidents. Every turn re-reads the context, so input grows with the square of the turn count: 3.09M input tokens per incident against 1.38M.
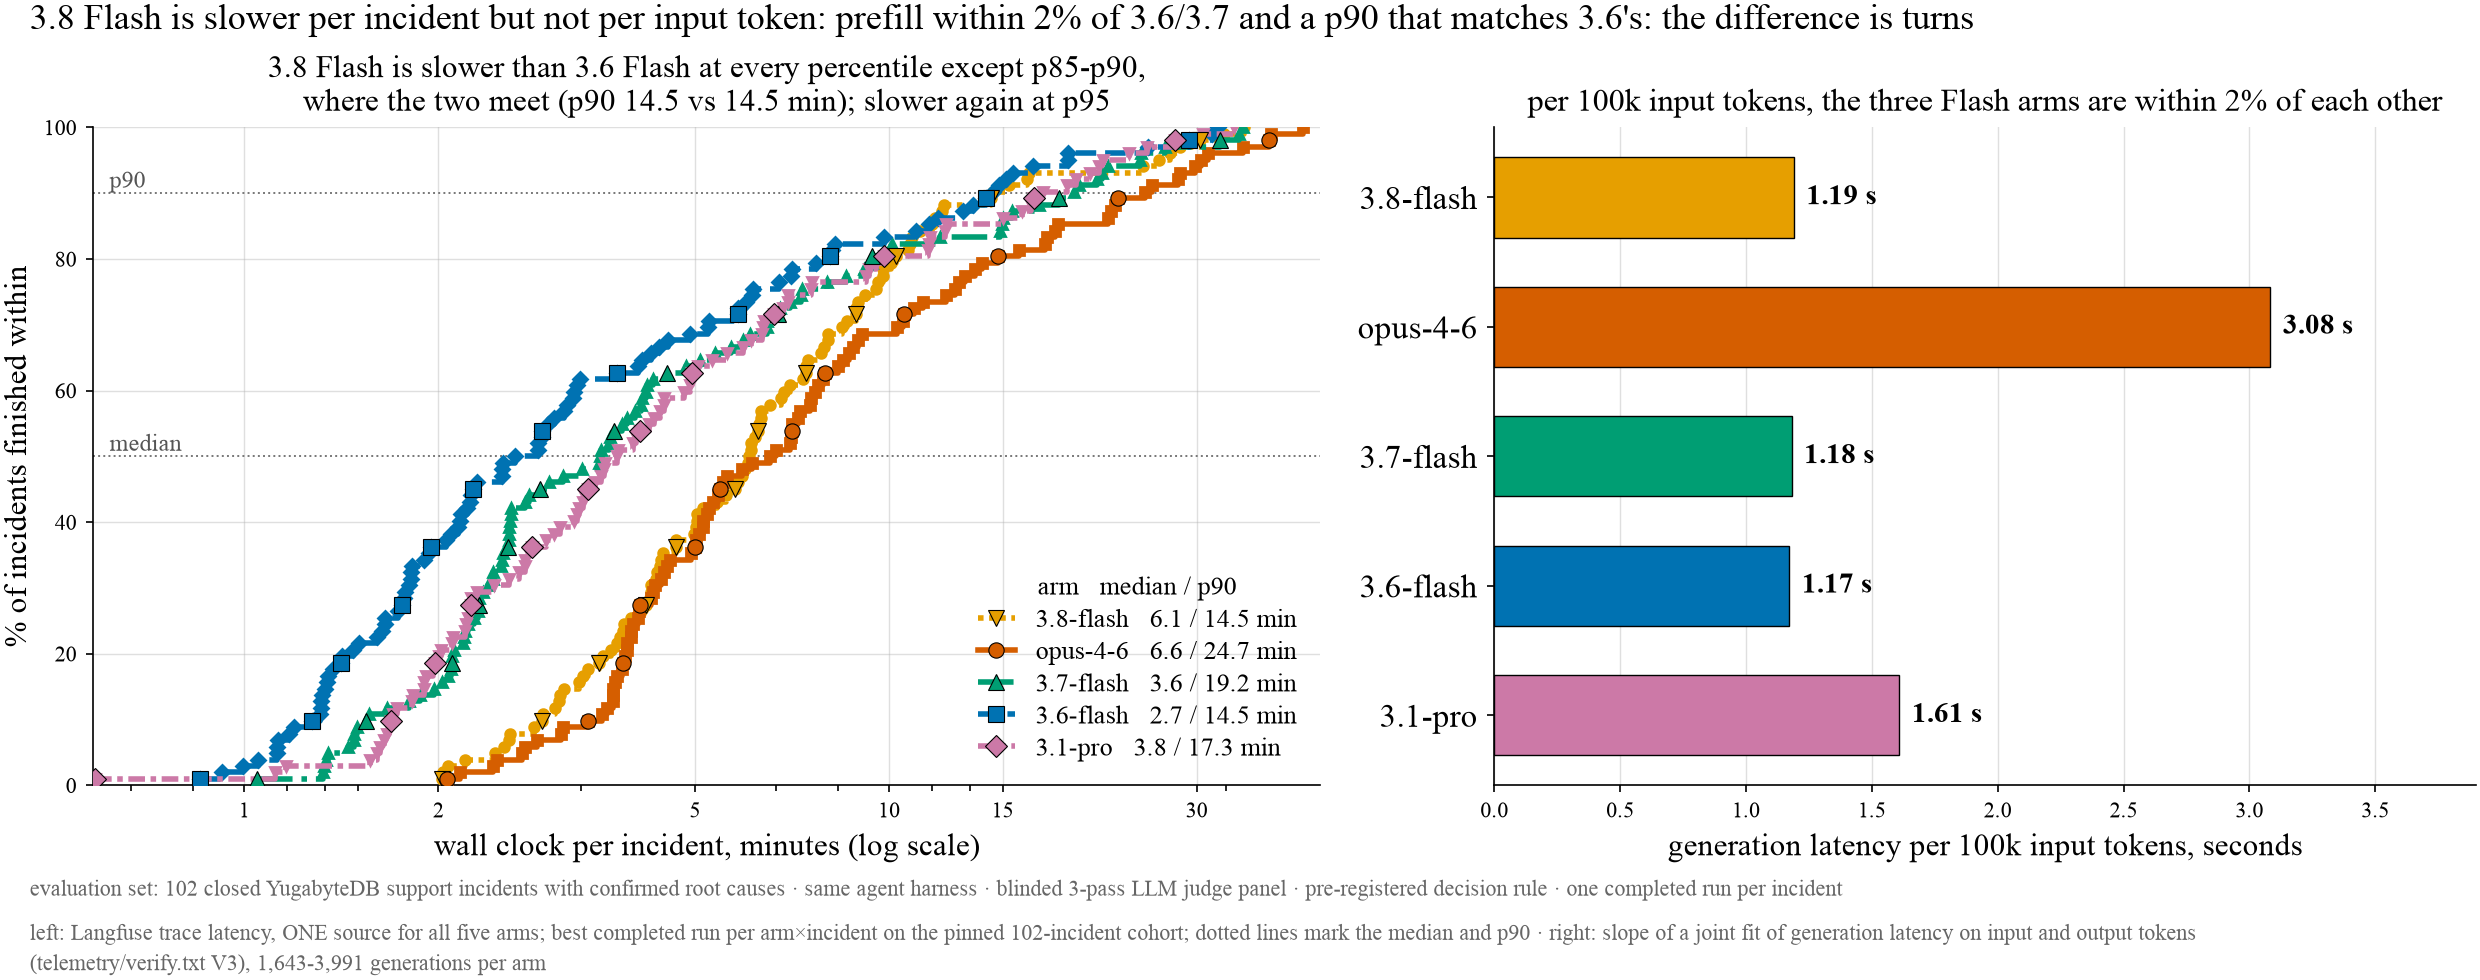
We ruled out our own side. Not prefill speed: 1.17, 1.18 and 1.19 seconds per 100k input tokens across 3.6, 3.7 and 3.8 Flash. Per 1,000 output tokens the three do differ, 3.0, 4.6 and 6.5 seconds, and that is turns too: more turns, more generation. Not the harness: parallel calling was never disabled, and 3.8 Flash did issue concurrent calls in 40 turns. Not the prompt: on five tools the prompt never sequences, the comparison arm kept 625 of 1,226 consecutive same-tool calls inside one turn; 3.8 Flash kept 0 of 1,929. Google's documentation says 3.8 Flash calls tools iteratively by design. This is that design, measured.
The 3.7 Flash round taught the same lesson a different way: at the same price per token, 3.7 Flash read 1.7x the input tokens of 3.6 Flash (means, 1.55M against 0.91M per incident; on medians 1.6x) and made 37% more tool calls (means, 22 against 16), so cost per incident rose from $0.72 to $1.19 while accuracy tied (37% against 38% exact, 14 wins to 13 paired).
We are moving our default to 3.8 Flash and accepting the cost for now. Two asks to the vendor, both cheap. Cached-token counts in the usage payload, so billed input can be reported instead of raw context. And a flag or a documented hint that batches independent tool calls in a long loop, so the accuracy cost of batching, if any, can be measured. In our own data the least-batching Gemini arm is also the most accurate; four arms prove nothing, but it is why I ask for a flag rather than a changed default.
How long the engineer waits
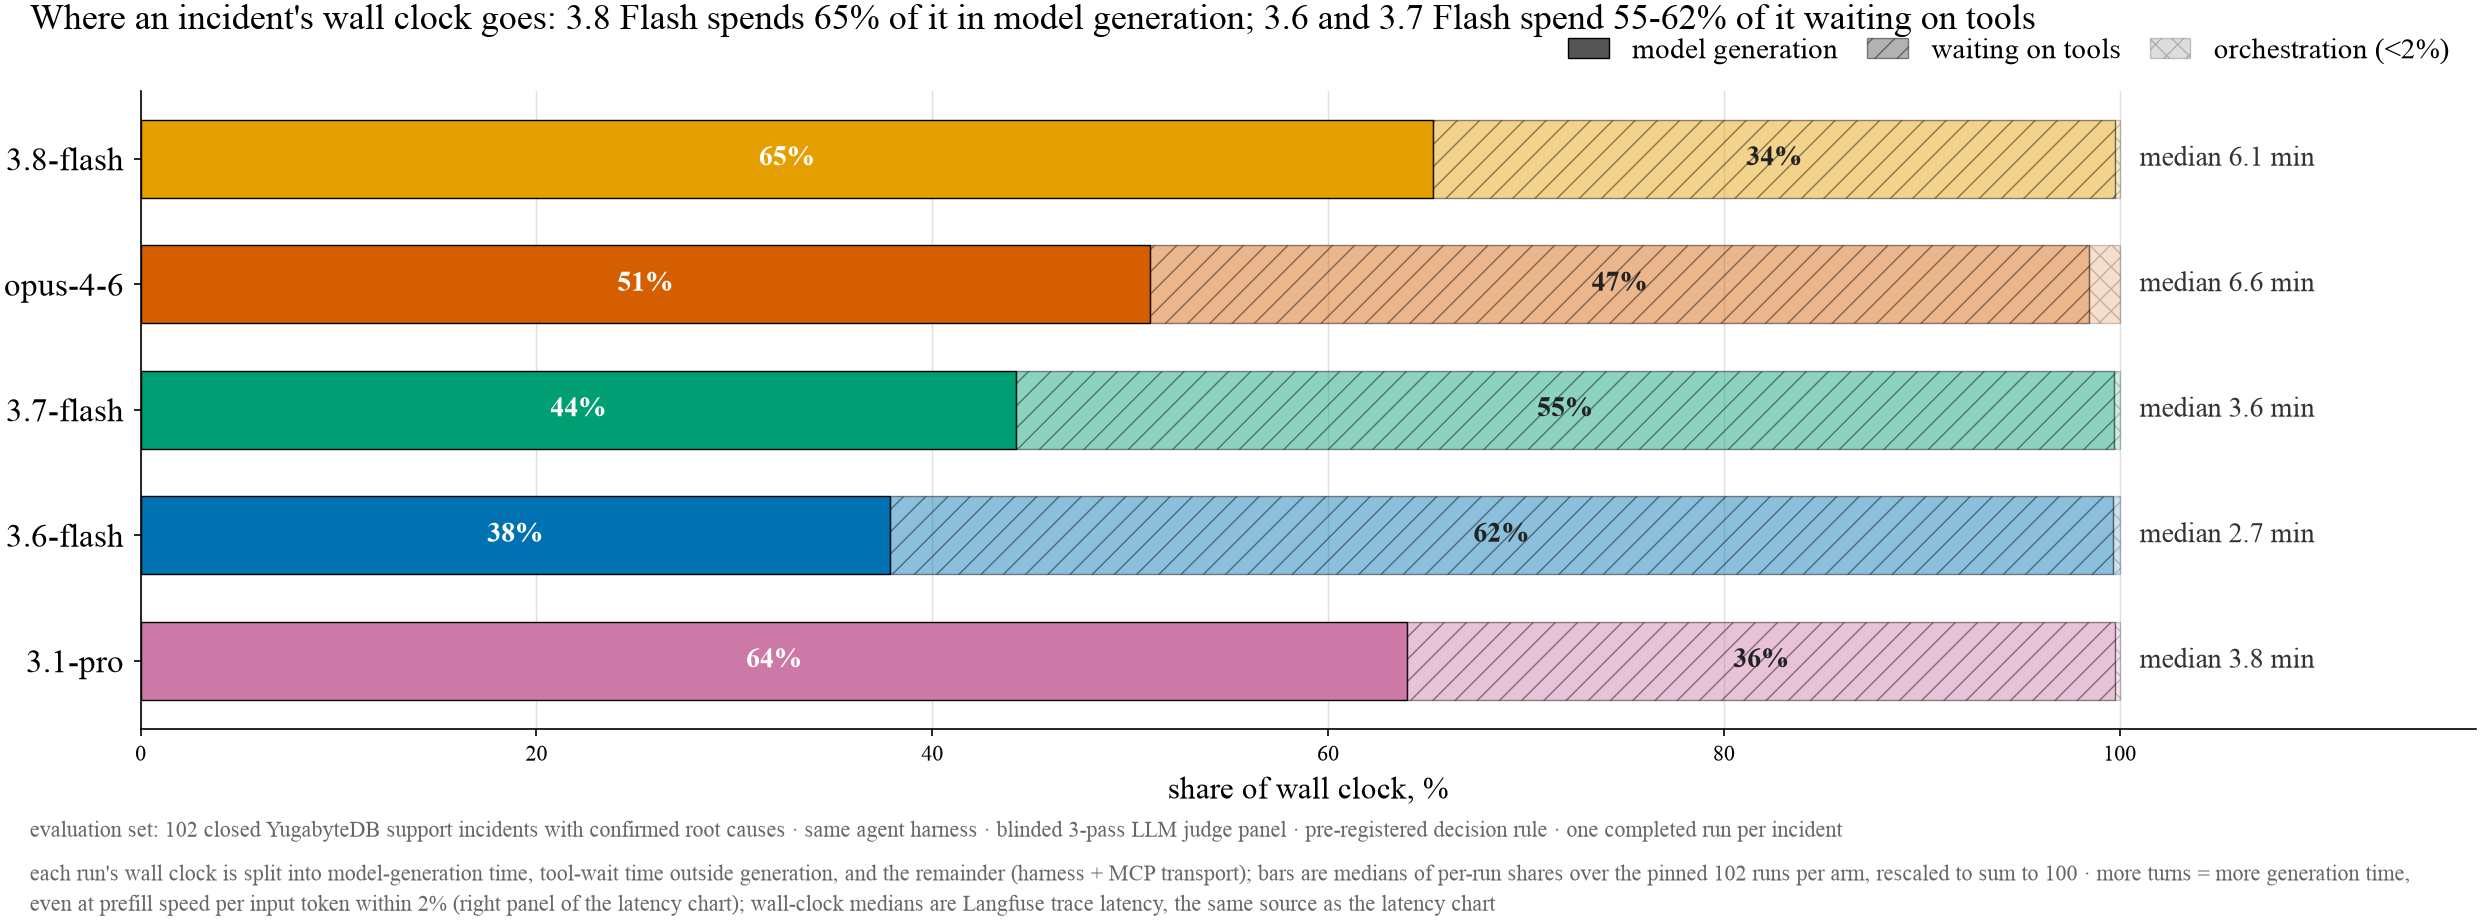
Wall clock matters on an incident queue. 3.8 Flash takes a median 6.1 minutes per incident against 2.7 for 3.6 Flash. Its p90 (14.5 minutes) matches 3.6's; above that it is slower again. The time is turns, not prefill: per 100k input tokens the three Flash arms are within 2% of each other. Where the minutes go changed: 3.6 and 3.7 Flash spent 55 to 62% of an incident waiting on tools; 3.8 Flash spends 65% generating. For the queue this means the assessment is ready in the time it takes an engineer to read the ticket and open the bundle, not before.
What I decided
Five decisions came out of this, and each traces to a number above.
- The agent drafts; the engineer decides. One in ten assessments still points the wrong way. That sets the supervision model, not the 90%.
- No gate on self-report. We had stopped gating production on the agent's confidence before this run; the data says that was right. Engineers see the assessment and the evidence it cites. They never see a confidence badge. Where two arms disagree, they see the disagreement.
- Move the default to Gemini 3.8 Flash and accept the cost for now. Halving the wrong-answer rate is worth more to the queue than the token bill. The bill is a turns problem, and I am asking the vendor for two things: cached-token counts in the usage payload, and a flag that batches independent tool calls in long agent loops.
- Evaluate on our own closed incidents, pre-register the rule, use a blinded panel. Benchmarks told us none of the above. A model that ties its predecessor on a leaderboard can double the cost per incident and halve the wrong rate on ours. The only evaluation that transfers to the queue is one run on the queue's own cases, and on enough of them. Our first harness of 25 produced a conclusion the 102-case harness reversed; the size of the evaluation set is a decision, and under-sizing it is how a leader ends up confidently wrong.
- Publish the corrections with the results. The 25-incident calibration claim reversed at 102. A team that will act on an agent's output has to trust that the people choosing the agent will say so when the evidence turns.
What this means for the KPIs I am accountable for
A support and services function is judged on outcomes and return, on how the team performs, develops and holds together, and on what the customer feels. This study measures the agent, not the function. Here is what it does and does not tell me about each, and how the gap gets closed.
Outcomes. The leading indicator is here: a usable draft on 90% of incidents, a wrong one on 10%. The lagging indicator is time to resolution on the live queue, which we track and which this study does not report. The 10% is what protects it: the supervision model exists so a wrong draft costs the engineer minutes, not the customer hours.
Return. The cost side is measured: turns, tokens and about six minutes of wall clock per incident. The benefit side is engineer minutes saved per usable draft, minus minutes lost per wrong one, and a wrong path costs more than a right one saves. That asymmetry is why halving the wrong rate mattered more to me than the token bill, and why we accept the cost of 3.8 Flash for now. The full return is a queue measurement, not a benchmark one, and it is the next report.
Team performance and development. The largest field study of AI assistance in technical support (Brynjolfsson, Li and Raymond) found the gain was distributional: resolutions per hour rose 13.8% overall, 34% for the least experienced agents, and not at all for the most experienced, who showed a small decline. I expect the same shape on our queue. So we will measure by tenure band, not on the average, and the design choice that engineers see evidence rather than a confidence badge is deliberate: reading the evidence is the skill we want the drafts to build, not to replace.
Team cohesion. Every engineer receives the same draft for the same incident, so the assessment becomes a shared object to argue with rather than a private shortcut. Where two arms disagree, the team sees the disagreement. The risk is the senior engineer who gains nothing from a draft and resents reviewing it; the field study says that risk is real, and adoption by tenure is the number to watch.
Customer satisfaction. In that same field study customer sentiment did not move. Ours will only move if the supervision model fails and a wrong draft reaches a customer unchecked. That is the failure this report is designed to make rare, and CSAT by incident type is how we will know.
What I tried to kill it with
- The page cap. The first telemetry crawl read only the first page of observations per trace. It truncated 22 of the 32 early 3.8 Flash traces and made the per-turn context curve look as if it descended. Re-crawled: 0 of 510 runs descend. The "pruning" finding died.
- Wrong turn count. An early 40.6 turns per incident came from that truncated cohort and misfit the closed form by 23%. The full cohort gives 37 and fits within 8% at the arm median.
- Our own prompt. It orders the agent's opening moves, so early-turn comparisons are contaminated. The batching finding was re-measured only where the prompt is silent. It held.
- Our own harness. Checked that parallel calls were never disabled and that the client passes concurrent calls through. It does; 3.8 Flash used the path in 40 turns.
- Mean against median. Several early figures mixed the two in one panel. Every figure now states which it shows.
- The metric change. Moving from exact match to usable after judging could flatter the result. Exact match is shown beside usable in every table and figure, and the paired test is reported under both.
- The judge. A rounding rule in the judge's tie-break could not produce PARTIAL from a split panel. Found, fixed, and the panel re-scored.
What died
- My August praise of 3.6 Flash's calibration, and with it any plan to gate on self-report.
- "3.8 Flash prunes context": an artifact of a paging bug.
- A prediction that 3.8 Flash would over-claim at a rate between 3.6 and 3.7. It came in below both.
- "3.8 Flash's tail latency is tighter than 3.6's." Its p90 matches 3.6's; above p90 it is slower again. Only the p90 statement survives.
Pressure tests
| claim | test | result |
|---|---|---|
| 3.8 Flash more usable than the comparison arm | paired McNemar on 87 incidents | 14 to 4, mid-p 0.019; Holm across four comparisons: all pass |
| Same claim on exact match | same | 12 to 8, mid-p 0.38, a tie |
| Self-report can gate the queue | AUROC, cluster permutation, 10,000 reps | 0.460, p=0.315; flag alone 0.518, p=0.661. No |
| Cost gap is turns, not calls | paired turn and call counts | more turns in 95 of 102; median call difference +4 |
| Serial calling is our prompt | five tools the prompt never sequences | 0 of 1,929 batched vs 625 of 1,226 for the control |
| Serial calling is our harness | client path check; concurrent-turn count | path works; 40 concurrent turns observed |
| 3.8 Flash is slow per token | prefill slope, joint fit | 1.19 s per 100k, within 2% of 3.6 and 3.7 |
| Context is pruned mid-run | per-turn input series, 510 runs | 0 descend |
What this does not show
One workload, one domain, one harness. Every arm ran at its shipped provider default with no thinking budget set on any of them; a thinking-level sweep is separate work and is not in this study. One completed run per incident per arm, and runs move: when we reran one arm on 16 of the same incidents, 5 judged labels changed (3 up, 2 down), and re-judging identical text changed 2 of 16, so a single run is an estimate with a wide interval, not a fixed score. Two of 102 3.8 Flash runs hit a 12M-token cap on their first attempt and completed on retry, so the token figure is a floor. Token counts are raw context, not billed input: the traces carry no cache fields, and implicit caching is on by default, so billed cost is unmeasured on every arm. The judge panel's two models are also two of the five arms; 3.8 Flash is not a judge. Dollar figures for the Flash arms in the 3.7 round were computed from measured tokens at list price because the telemetry had no pricing rows for them. Nothing here measures what happens to an engineer's own judgement after months of reading agent drafts. For a support leader that is the next question, and it is the one the published literature answers least well.
Reproduce
The repository is private and will stay so: the incidents are real customer diagnostic bundles
and support tickets. What is public is this report, the figures
it references, and numbers.json, which holds every value printed here so the
text can be checked against one source. The method is fully described above; the
pre-registration commits are timestamped in the private repository's history and can be shown
on request. Aggregate per-arm data can be shared after pseudonymisation and an identifier scan,
under an appropriate agreement.