The Portuguese season as it stands
- Updated
- Data
- 2026-W36
- Figures
- 2
Updated: 2026-09-05 · Snapshot: 2026-W36 · Claim level: L2 (hypothesis, pre-registered)
This page changes. Every other report here is dated and finished. This one tracks a season in progress against a test that was sealed before the season started, and it will keep changing until that test resolves on 15 November 2026.
It exists separately for one reason: a live question with a resolution date does not belong inside a dated study, because it makes that study permanently unfinished.
What is being watched
Study 02 examined a viral claim that one Portuguese club was being favoured by referees, and found the effect belonged to the fixture rather than the club. Over ten completed seasons Porto's referee-adjusted booking index is 1.002 — average.
Then the current season started, and Porto took 58 fouls and one yellow card in four matches.
Where it stands
Portugal through matchweek 4, snapshot 2026-W36, 33 matches. Produced by
scripts/season_status.py alongside season_status.json.
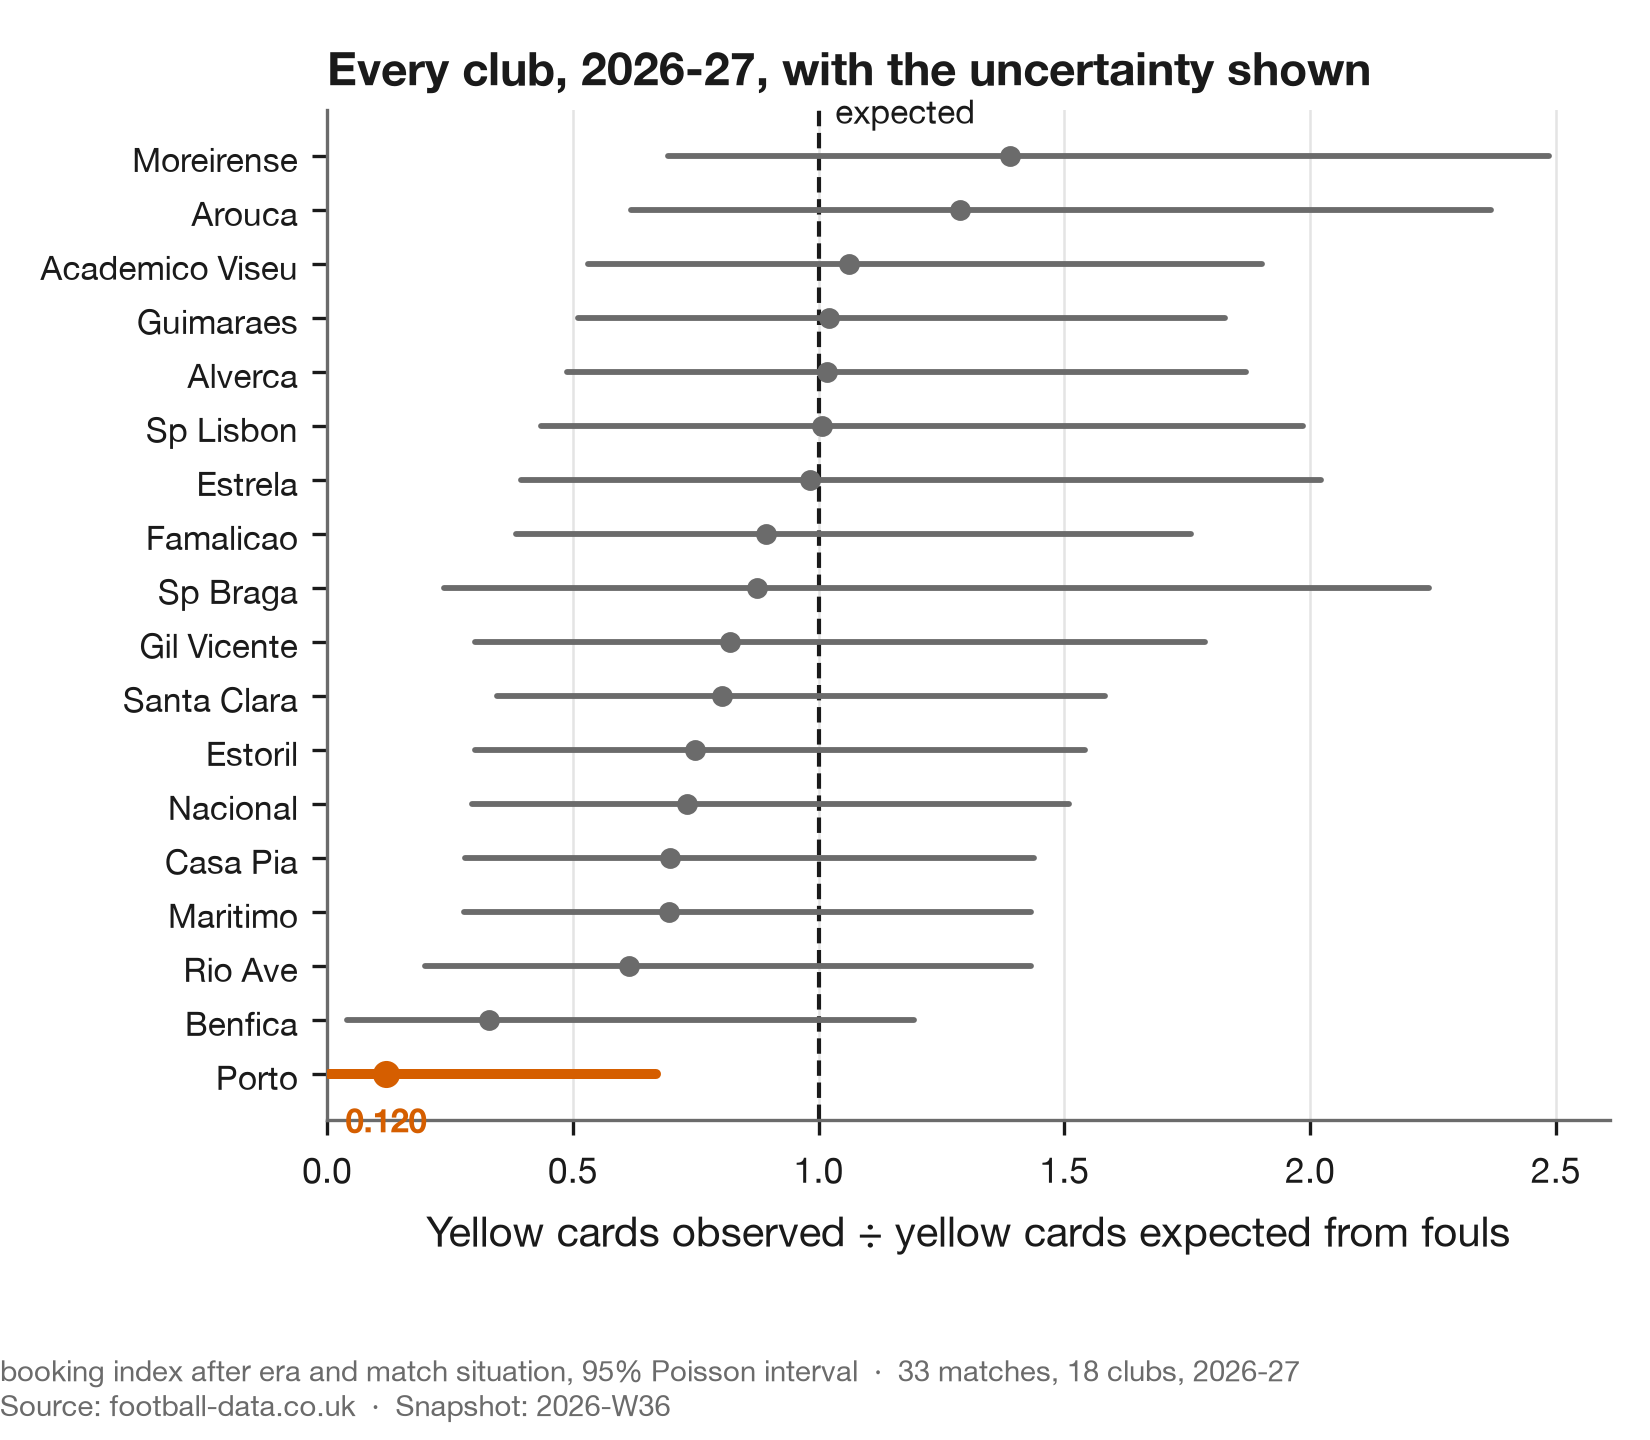
The intervals are the point. Four matches leaves every club's estimate wide enough to admit almost anything, and the only reason one club reads as unusual is that it sits outside the spread of seventeen others measured just as badly.
The situation multiplier comes from the completed seasons and is deliberately not refitted here:
heavy favourites 0.830, favourites 0.941, even 1.036, underdogs 1.085, heavy underdogs 1.103.
Letting four matches set their own baseline would defeat the point of having one — and study 02's
own pipeline made exactly that mistake elsewhere, which is recorded in METHODS.md §11.
| Club | Matches | Fouls | Yellows | Expected | Index | 95% interval | BH |
|---|---|---|---|---|---|---|---|
| Porto | 4 | 58 | 1 | 8.34 | 0.120 | [0.003, 0.668] | 0.081 |
| Benfica | 3 | 41 | 2 | 6.05 | 0.330 | [0.040, 1.193] | 1.000 |
Porto were heavy favourites in all four matches, so the situation adjustment already works in their favour and takes the expectation from 10.04 down to 8.34. One yellow against that is still far out. Across all 18 clubs, 1 survives a Benjamini–Hochberg screen at FDR 0.10, and it is Porto at an adjusted p of 0.081.
Note how close that is to the threshold. The era-only model gives an adjusted p of 0.017; adjusting for the fact that Porto are favourites nearly quadruples it. Both numbers are reported because the difference between them is the entire subject of Wrong (1) in study 02.
So it is not an ordinary early-season fluctuation. It survives the screen built to dismiss those.
Why that is not yet a finding
It is four matches. The interval on Porto's index runs from 0.003 to 0.668, which admits almost anything. And study 04 puts 85% of the spread in a single season's booking index down to sampling noise — before you even get to a four-match sample.
A striking number arriving early and feeling conclusive is the exact situation the pre-registration was written to handle.
Could they just be fouling in safer places?
The most natural objection, and it has a ceiling.
Study 03 measures an enormous card-risk gradient by pitch position: 31.4% of fouls in a team's own defensive fifth are carded against 8.9% in the attacking fifth. If a club fouled almost entirely upfield, it would be booked less for the same number of fouls, and no adjustment used here accounts for that.
Two things make it an unlikely explanation, and neither requires measuring the Portuguese league.
The gradient transfers; the club-to-club differences do not. The gradient is present in 5 of 5 big-five leagues, with the own-fifth risk running from 2.5 to 5.0 times the attacking-fifth risk, so assuming Portugal has one too is safe. But clubs barely differ in where they foul. Across 98 clubs the mean foul position spans 48 to 58 on a hundred-point pitch, a tenth of the range the gradient covers, which is the whole finding of study 03.
So the ceiling is small. Taking each league's own gradient and finding the club whose actual foul placement is most favourable under it, the best placement profile in the most generous of the five leagues buys a 7.3% reduction in card rate. Applying that ceiling here — deliberately generous, since it is the best profile in the best league rather than anything measured in Portugal — moves the expectation from 8.34 to 7.73 and the index from 0.120 to 0.129. It accounts for 1.1% of an 88% shortfall, and the two-sided Poisson p moves from 0.0045 to 0.0077.
Placement is not the explanation. That conclusion is robust precisely because it was tested at its most favourable, and it would survive Portugal's gradient being twice as steep as any measured.
What it does not rule out is the thing no public data can see: whether the fouls themselves are
different in kind. Produced by scripts/placement_ceiling.py alongside
placement.json.
Has an opening like this ever become a season like this?
The archive can answer that without waiting for November. Every completed team-season in the snapshot is cut at the point Porto's season now stands, four matches in, and its opening is compared with the rest of the same season. The index used for this is deliberately cruder than the one in the table above: yellows over yellows expected at the league-season's own yellows-per-foul rate, with no situation adjustment, because the comparison needs one scale that exists for every club in every league. On that scale Porto's opening reads 0.112.
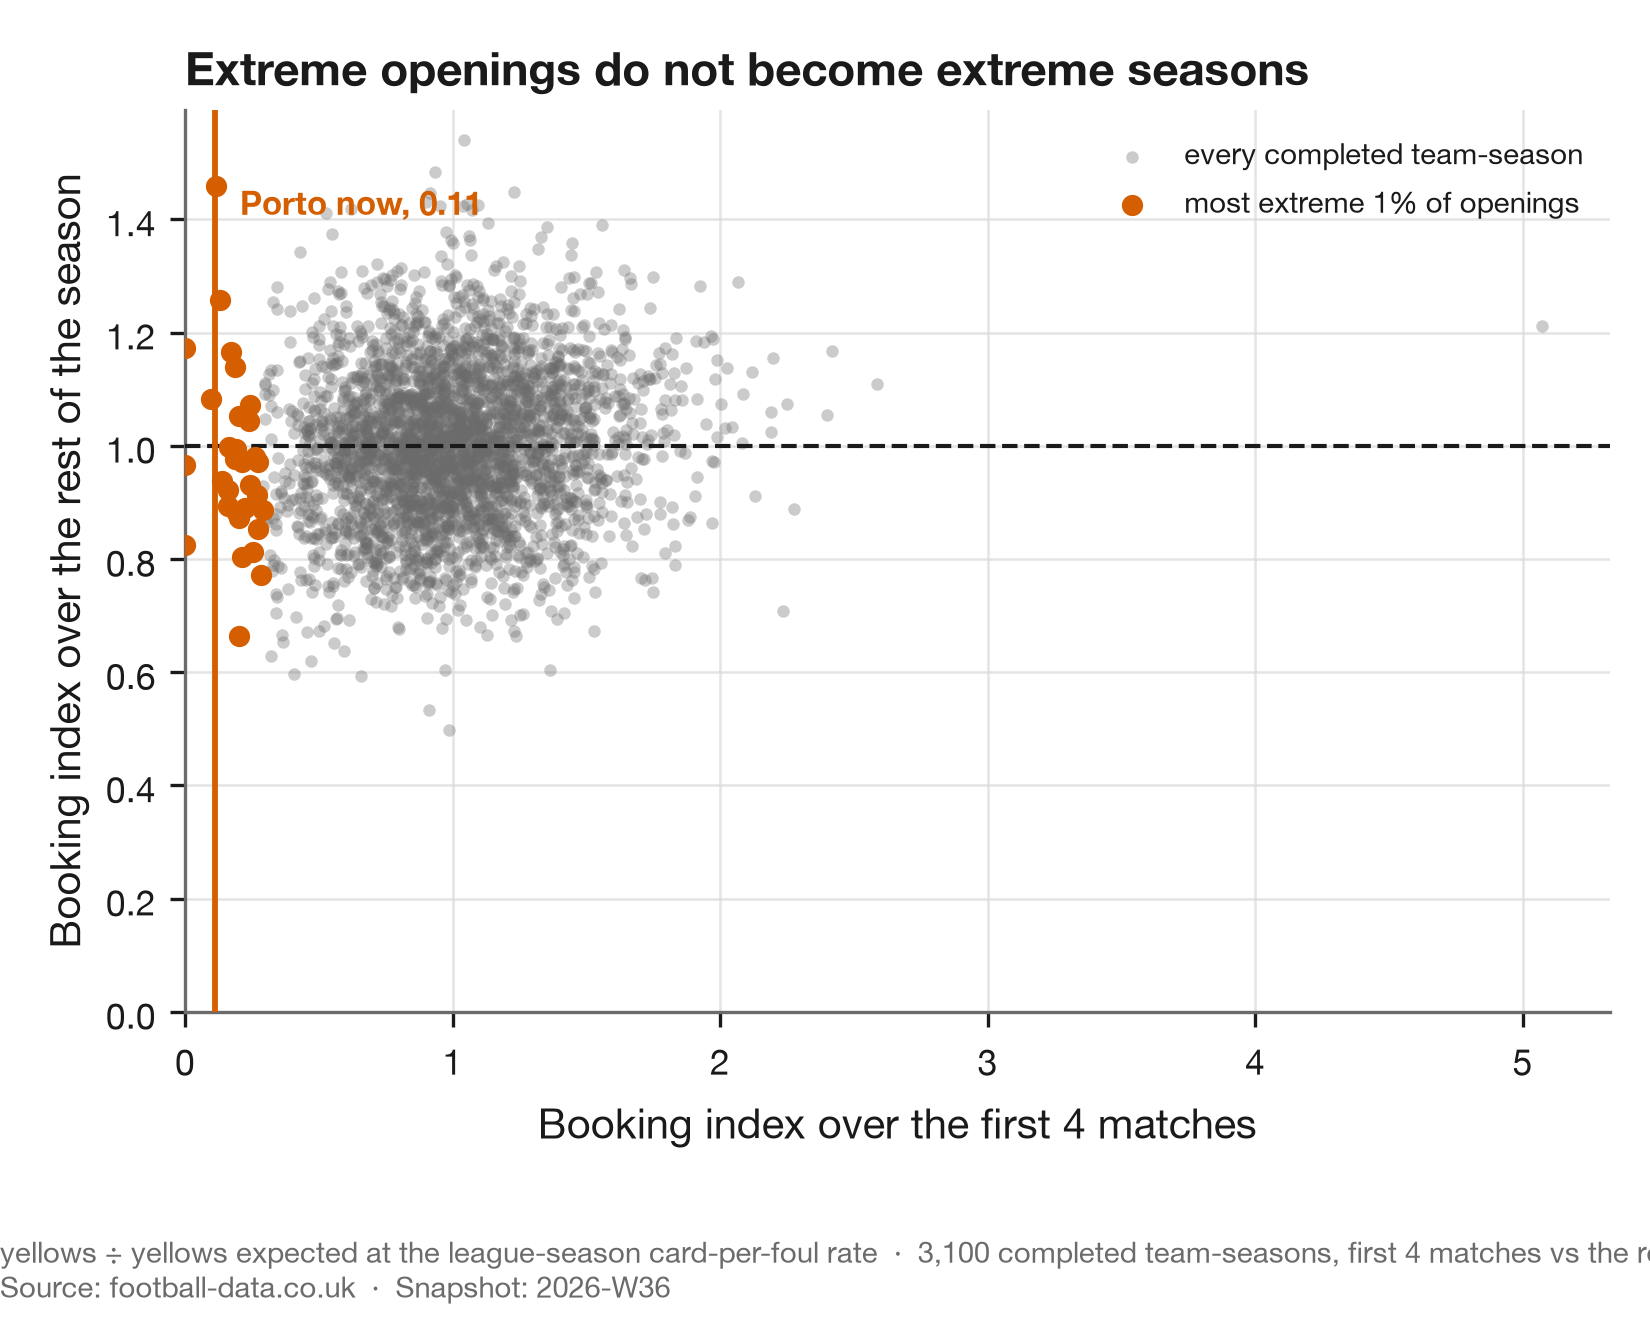
Across 3,100 completed team-seasons in eleven leagues, 4 openings were at least as extreme. Widening to the most lenient 1% of all openings, an index of 0.292 or below, gives 31 team-seasons to follow. Their rest-of-season index has a median of 0.965 and a minimum of 0.663. None finished as an outlier. The most lenient completed season in the whole archive is Celtic's 2024-25 at 0.548, and no opening in the extreme group came close to it.
The opening and the rest of the season are close to independent. The correlation between the two across all team-seasons is 0.12, and the first percentile of rest-of-season indices is 0.70: the bottom of what a full season does, once the opening is set aside, is not far below average.
The follow-up window matters for the sealed test. In the seven matches after their opening, those 31 clubs took between 5 and 29 yellow cards: 7 stayed at or below the pre-registration's "real" line of seven, 9 landed in the ambiguous band, 15 crossed into noise. The typical club in the archive takes 14 yellows in any seven-match stretch. The typical Portuguese club takes 19, and Porto's own nine completed seasons here never produced fewer than 14 in matches five to eleven. Their rest-of-season index over those seasons ran from 0.744 to 1.081.
So the sealed test's "real" threshold is a high bar in this league, set before this comparison
was made, and the base rate for clearing it from an opening like this is roughly one in four. That
is the reading this page carries into the autumn: unusual, surviving the screen, and historically
followed by reversion every time. Produced by scripts/opening_reversion.py alongside
openings.json.
The sealed test
The pre-registration was written on 30 August, before this data existed. It counts Porto's yellow cards across matchweeks 4 to 10:
| Count | Reading |
|---|---|
| 7 or fewer | real |
| 8 to 11 | ambiguous |
| 12 or more | noise |
One matchweek is in and the count is zero. It resolves on 15 November, whichever way that falls.
The pre-registration also records its own contamination, which is the part worth reading: the threshold that started this was chosen after seeing the data, and the document says so rather than pretending otherwise.
Pressure tests
METHODS.md §11, applied to the live claim rather than to a completed finding.
| Attack | Status | What happened |
|---|---|---|
| Specification | run — survived | The expectation is the frozen affine model, 1.1259 + 0.095491 × fouls, fitted on completed seasons. Study 02's proportional-through-the-origin version is what Wrong (2) was about, and using it here would inflate exactly this club. |
| Aggregation | run — survived | The index is computed per club over its own matches, and the situation multiplier is estimated from the other ten seasons, so no part of this club's own live record sets its own baseline. |
| Adjustment coarseness | skipped | The situation multiplier is banded into five strength levels here rather than fitted continuously, because it is deliberately frozen from study 02's pre-registration. A continuous refit would be a better adjustment and a broken pre-registration. The banding under-corrects heavy favourites, which makes this reading conservative against the club. |
| Prior work | not applicable | No prior work is being extended. This is a status page against a sealed test. |
| Baseline sufficiency | run — survived | Two nulls. The Benjamini–Hochberg screen across all 18 clubs asks what the most extreme club would look like if nothing were happening, and one club clears it. The archive of 3,100 completed team-seasons asks what openings this extreme did next, and the answer is that every one of them reverted. |
| Cross-sectional, few units | not applicable | No correlation across aggregate units is claimed. |
Reproduce this
uv run python scripts/season_status.py
uv run python scripts/placement_ceiling.py
uv run python scripts/opening_reversion.py